Figure 1.
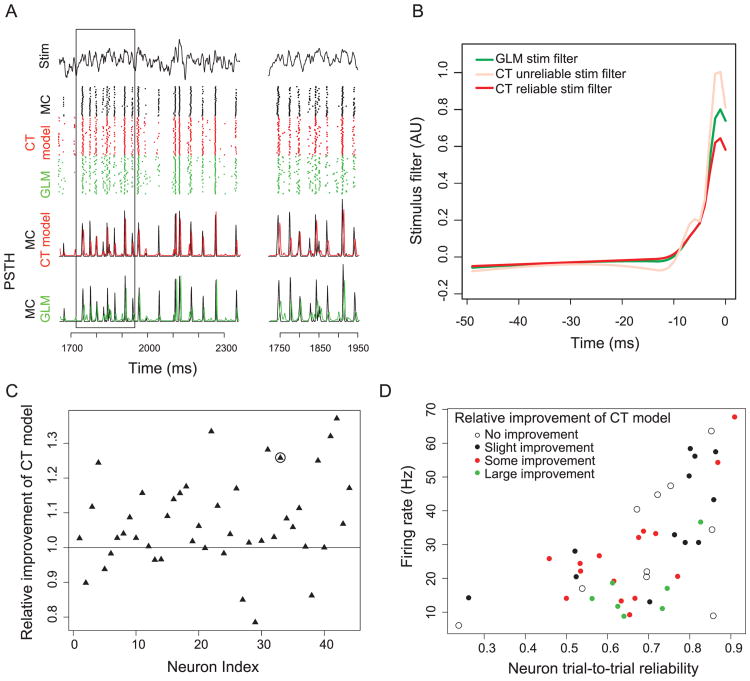
Comparison of generalized linear model (GLM) and current thresholded model (CT model) in capturing dynamic mitral cell (MC) spiking activity. (A) MC intrinsic properties are probed using filtered broadband frozen noise (first row) injected into the soma. MC spike rasters (second row; black) and PSTH (third row; black) for repeated stimulus presentations (n = 40 trials). Corresponding model-based rasters and PSTHs for GLM (green) and CT model (red) show that the CT model better captures temporally precise MC spiking activity. PSTH smoothed with gaussian with σ = 2 ms and are slightly offset for visual clarity. The inset on the right indicates boxed segment on left. Data shown here include only test data not used to train model parameters. (B) Model stimulus filters for GLM (green) and CT model (unreliable stimulus filter, light red; reliable stimulus filter, dark red) for a representative MC. t = 0 ms indicates current time bin. (C) Relative improvement of CT model (with a = 1) compared to GLM. Improvement is quantified by first calculating the sum of squared errors between MC and model PSTHs and then calculating the ratio between GLM and CT model SSE. Higher ratios indicate that the CT model is a better model for MC activity than GLM. The x-axis indicates MC identity (n = 44 MCs). The circle indicates MC shown in panel A. (D) Analysis of MC features compared to CT model improvement relative to GLM. The x-axis indicates neuron trial-to-trial reliability, computed as the proportion of PSTH peaks defined as reliable relative to all PSTH peaks. The MCs split into four categories based on CT model improvement (with a = 1) relative to standard GLM model: no improvement (white; ratio of SSE < 1.0), slight improvement (black; 1.0 ≤ ratio of SSE < 1.05), some improvement (red; 1.05 ≤ ratio of SSE < 1.2), and large improvement (green; ratio of SSE ≥ 1.2).

