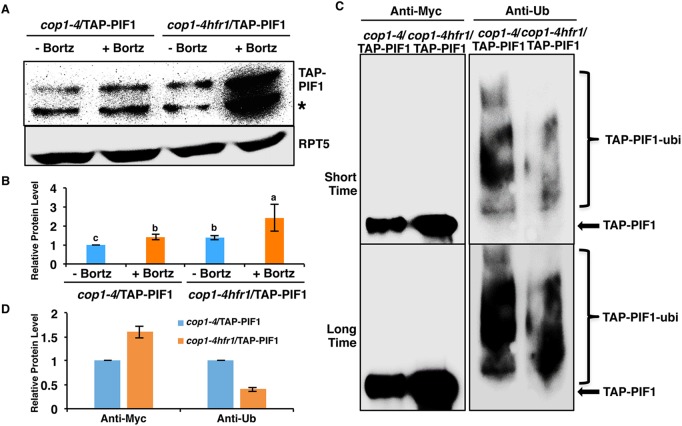
Fig. 3.
HFR1-mediated PIF1 degradation is 26S proteasome dependent. (A) Immunoblot shows the TAP-PIF1 level in cop1-4 and cop1-4 hfr1 background. Total protein was extracted from 4-day-old dark-grown seedlings. One batch of seedlings was pretreated with 40 µM Bortezomib (Bortz) for 3 h before protein extraction. The blot was probed with anti-Myc or anti-RPT5 antibodies. Asterisk indicates a cross-reacting band or proteolytically cleaved product. (B) Quantification of TAP-PIF1 protein level using RPT5 as a control. The letters a-c indicate statistically significant differences among four samples and two treatment conditions (P<0.05) based on two-way ANOVA analyses. Error bars indicate s.d. (n=3). (C) TAP-PIF1 level is higher but the ubiquitylation level is lower in the cop1-4 hfr1 compared with cop1-4 background in darkness. Total protein was extracted from 4-day-old dark-grown seedlings with 40 mM Bortezomib pretreatment for 3 h before protein extraction. TAP-PIF1 was immunoprecipitated using anti-Myc antibody from protein extracts. The immunoprecipitated samples were then separated on 6.5% SDS-PAGE gels and probed with anti-Myc (left) or anti-Ub (right) antibodies. The top and bottom panels are low and high exposures, respectively. Arrow indicates TAP-PIF1. (D) Quantification of TAP-PIF1 and TAP-PIF1-ubi protein levels shown in C. The TAP-PIF1 and TAP-PIF1-ubi protein levels in cop1-4 background were set as 1 respectively. Error bars indicate s.d. (n=3).

