Fig. 4.
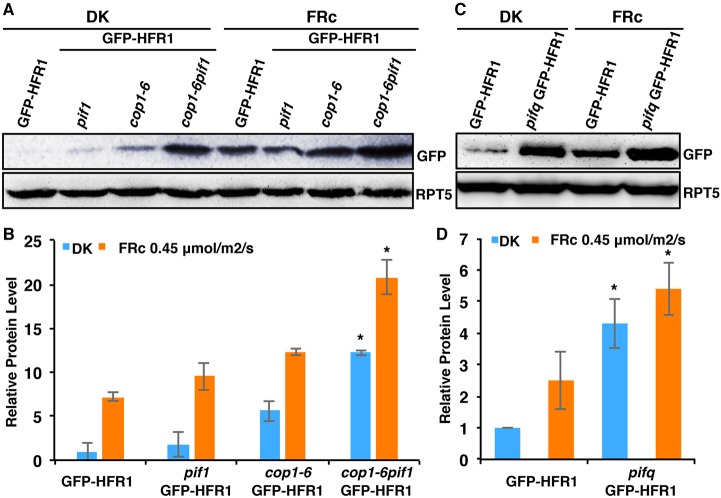
PIFs promote the degradation of HFR1 post-translationally in the dark and under far-red light. (A) Immunoblot shows HFR1 protein level in GFP-HFR1 transgenic plants and in pif1, cop1-6 and cop1-6 pif1 harboring the GFP-HFR1 transgene. Seedlings are grown either in the dark for 4 days or grown in the dark for 21 h and then transferred to FRc (0.45 μmol/m2/s) for 3 days. The blot was probed with anti-GFP or anti-RPT5 antibodies. (B) Bar graph shows GFP-HFR1 protein level in the mutants indicated. For quantification, GFP-HFR1 band intensities were measured from three independent blots using ImageJ, and then normalized against RPT5 levels. GFP-HFR1 dark level was set as 1 and the relative protein levels were calculated. Error bars indicate s.d. Asterisk indicates significant difference (P<0.05) between double and single mutant background. (C) Immunoblot shows HFR1 protein level in the GFP-HFR1 and pifq/GFP-HFR1. RPT5 was used as loading control. Seedlings were grown in the dark or FRc light as described above. (D) Bar graph shows the quantified GFP-HFR1 levels in GFP-HFR1 and pifq/GFP-HFR1. Error bars indicate s.d. Asterisk indicates significant difference between GFP-HFR1 and pifq/GFP-HFR1 in both conditions, respectively (P<0.05). DK, dark.

