Fig. 6.
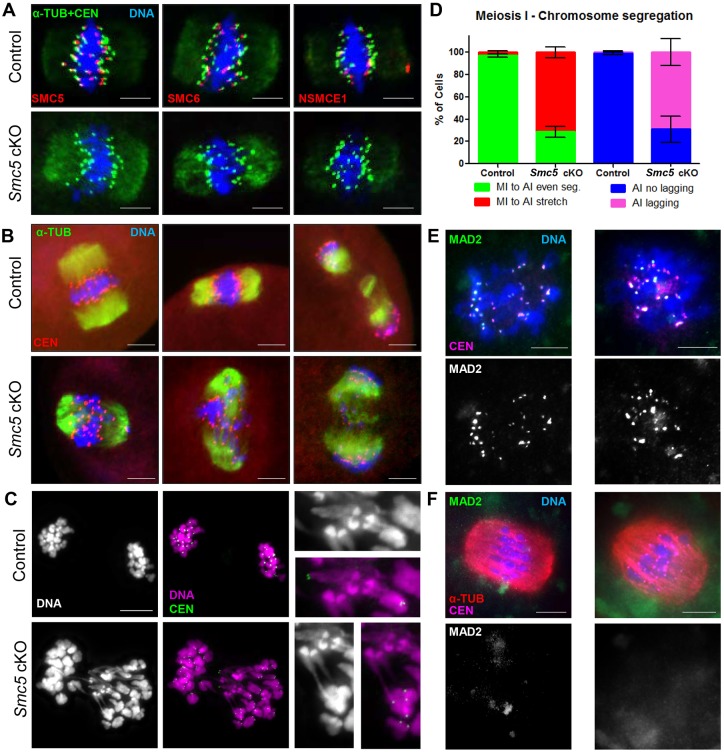
Smc5 cKO oocytes display lagging and stretched chromosomes during meiosis I. (A) Metaphase I oocytes from control (Smc5 +/flox, Zp3-Cre tg/0) and Smc5 cKO (Smc5 flox/del, Zp3-Cre tg/0) mice, DAPI (blue, DNA), α-tubulin (green, α-TUB), CEN (green) and a subunit of the SMC5/6 complex (SMC5, SMC6, NSMCE1, red). (B) Oocytes transitioning from metaphase I to anaphase I; DAPI (blue, DNA), α-TUB (green) and CEN (red). (C) Smc5 cKO oocyte undergoing metaphase I to anaphase I transition displaying chromatin stretching; DAPI (purple, DNA) and CEN (green). Images with a 3× magnification of chromosome stretches on the right. (D) Bar graph of percentages of oocytes (n=104 for control and n=167 for Smc5 cKO) showing even metaphase I to anaphase I chromosome segregation (MI to AI even), chromosome stretching (MI to AI stretch); and in anaphase I (n=40 for control and n=53 for Smc5 cKO) showing no lagging chromosomes (AI no lagging) and lagging chromosomes (AI lagging). The P values (one-tailed paired t-test) for the indicated comparisons are P=0.004 (MI to AI) and P=0.0078 (AI). (E) Pro-metaphase I and (F) metaphase I oocytes were stained with DAPI (blue, DNA), MAD2 (green) and CEN (purple). Collectively, at least 10 mice for each group were used to obtain the data. Scale bars: 10 µm.

