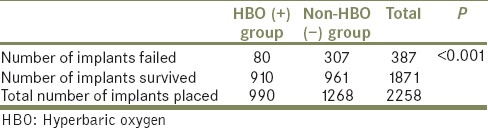
Table 12.
Represents “Pearson's Chi-square test” which shows the total number of implants placed, failed, and survived in both the groups, with P<0.001, which shows that significant difference exists between both the groups regarding the number of implants failed and survived