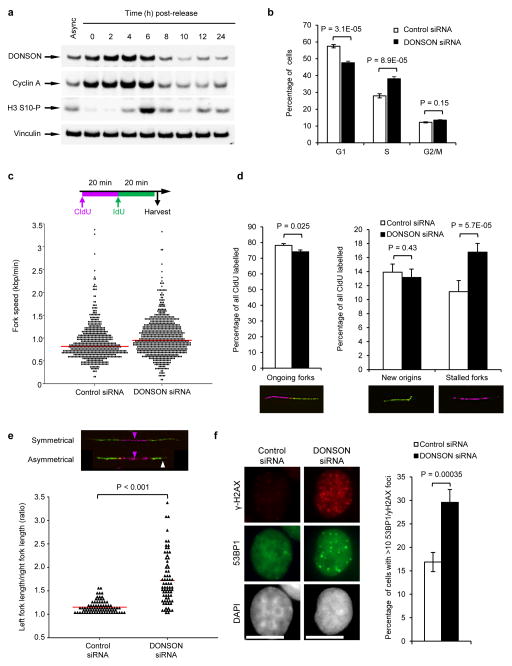
Figure 3. Loss of DONSON results in spontaneous replication fork stalling and increased genome instability.
(a) DONSON protein levels are increased during S-phase. HeLa cells were synchronised in S-phase using a double thymidine block, released, harvested at the indicated time points, and immunoblotting was performed (n=2). Cyclin A and phospho-histone H3 Ser-10 are markers of S/G2 and M phase respectively. Vinculin represents a loading control. (b) S-phase is prolonged upon DONSON depletion. HeLa cells transfected with the indicated siRNAs were pulsed with BrdU, fixed and analysed by FACS (n=4; error bars indicate SD). (c–e) Replication fork analysis of HeLa cells transfected with control or DONSON siRNA and pulsed with CldU and IdU. (c) Top: Schematic of DNA fibre analysis. Bottom: loss of DONSON does not decrease replication fork velocity. Replication fork speed (kb/min) was determined (n=5). (d) DONSON depletion results in spontaneous fork stalling. Percentages of ongoing replication forks, new origins and stalled replication forks in cells from (c) were quantified (n=3). (e) DONSON depletion leads to replication fork asymmetry. Top: example images; magenta arrows indicate origins of replication; white arrow denotes fork asymmetry. Bottom: plot indicates the ratio of left/right fork track lengths of bidirectional replication forks in cells from (c). Red lines denote median ratios (n=3). (f) Loss of DONSON increases spontaneous γH2AX/53BP1 foci formation. HeLa cells transfected with the indicated siRNAs were immunostained with antibodies to 53BP1 and γH2AX (left panel), and the percentage of cells with >10 53BP1 and γH2AX foci were quantified using fluorescence microscopy (right panel; n=5; >300 cells per sample per independent experiment). Scale bar; 10 μm.

