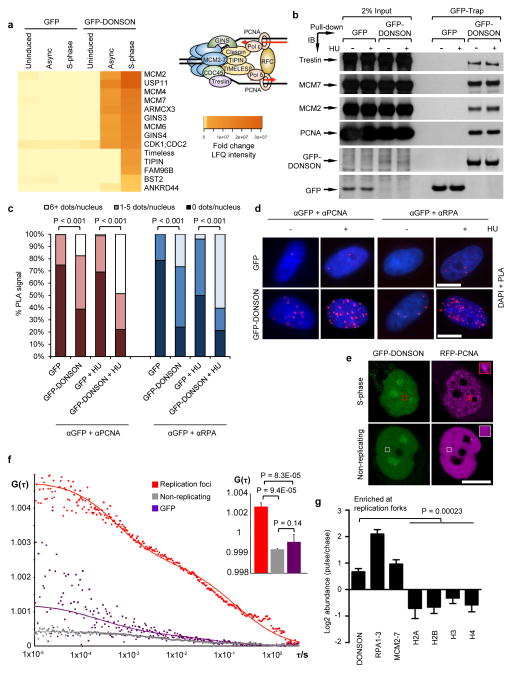
Figure 4. DONSON localizes to the replication fork.
(a–d) DONSON interacts with multiple components of the replication machinery. (a) GFP or GFP-DONSON was precipitated by GFP-Trap, from asynchronous cells or cells accumulated in S-phase with 2 mM HU treatment for 24 h. Heatmap denotes significant interactions identified by mass spectrometry (n=3). Inset: Schematic of the mammalian replisome with selected replication factors. (b) 293FT cells were transfected with the indicated expression vectors in the presence/absence of HU. GFP or GFP-DONSON were isolated by GFP-Trap and co-precipitating proteins visualised by immunoblotting (n=2). Benzonase Nuclease was included to exclude DNA-mediated interactions. The bottom two panels are scanned images of Ponceau S-stained nitrocellulose membrane. (c–d) DONSON localises in close proximity to replication forks. (c–d) PLA was carried out on cells from (a) using the indicated antibodies in the presence/absence of HU (n=2). (c) Quantification of PLA signals. (d) Representative PLA images. (e–f) DONSON interacts with PCNA at replication foci in live cells. (e) Representative confocal images of live cells expressing GFP-DONSON and RFP-PCNA. Boxes indicate representative regions used for FCCS analysis. (f) FCCS measurements of GFP-DONSON and RFP-PCNA reveal significant cross-correlation at replication foci at similar concentrations. Average cross-correlation curves are shown from cells expressing GFP-DONSON in replication foci (red) or non-replicating (grey) cells, or GFP-expressing S-phase nuclei (purple). Inset: Mean cross-correlation amplitude values from multiple cells (error bars indicate SD; n=4, 3 and 5). Increased G(τ) values indicate higher degree of cross-correlation between GFP-DONSON and RFP-PCNA in replication foci. See also Supplementary Fig. 11. (g) iPOND was performed on 293T (n=3), HeLa (n=2) and HCT116 (n=2) cells, and EdU-coprecipitates analysed by mass spectrometry. Data represents the combination of all seven experiments. Log2 abundance denotes the ratio of proteins at nascent DNA compared to mature chromatin. Values >0 represent proteins enriched at forks, whilst values ≤ 0 denote chromatin-bound factors. Scale bars; 10 μm.

