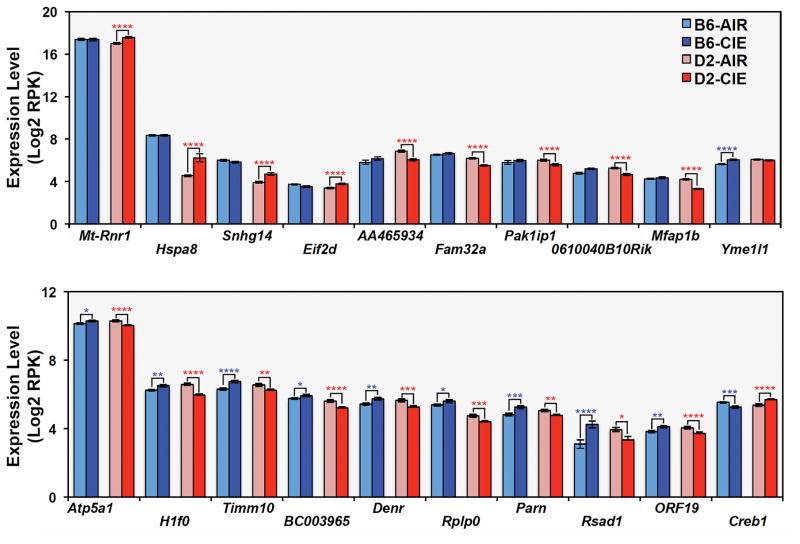
Fig. 3. Differential strain response to treatment.
At a 10% FDR level, 20 genes are associated with a treatment by strain effect on expression. Genes that show a significant effect of treatment on expression primarily in a single strain are shown in the top panel and genes that show a divergent expression response between strains following treatment are shown in the bottom panel. Significance levels based on pair-wise comparisons as follows: * = p < 0.05, ** = p < 0.01, *** = p < 0.005, **** = p < 0.001. Average log2 RPK values are shown on the X-axis for each group.

