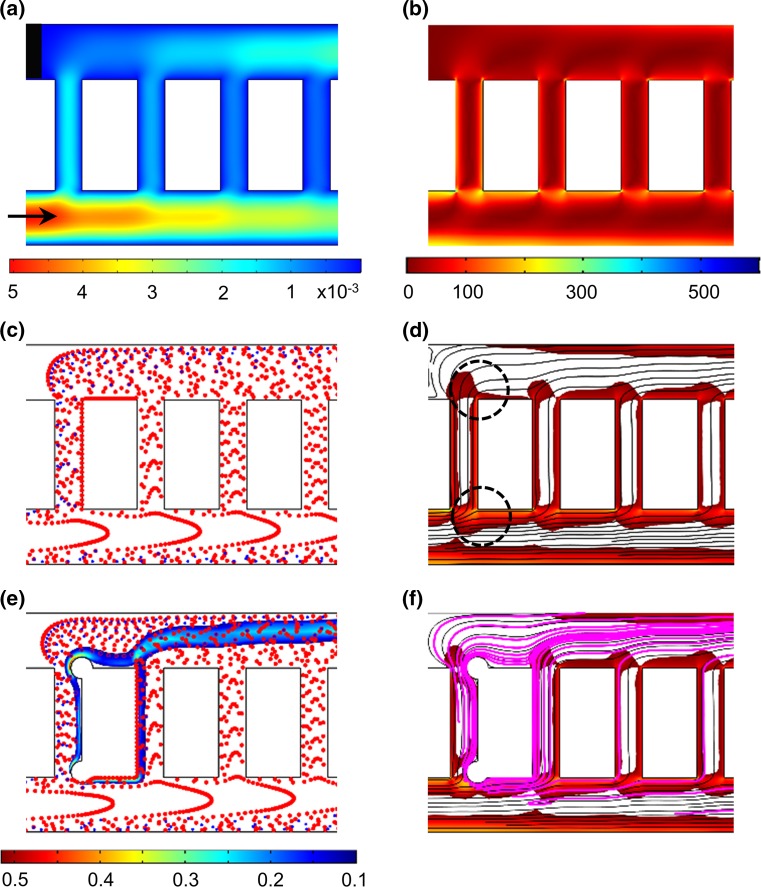
Figure 2.
Prediction of thrombus formation within the ladder network: nucleation and evolution. Computer simulation of blood flow velocity profile (a; µL/min), shear rate profile (b; s−1) and the initial blood cell distribution profile (c). A combination of velocity streamlines and shear rate gradient predicted a higher probability for the nucleation site for thrombus formation on the channel walls immediately downstream of intersections between main channels and bypasses (highlighted with black circles) (d). Computer simulations repeated in the presence of an obstruction to predict adjusted blood cell distribution profile during clot growth and thrombin convection mol/m3 (e) and combination of thrombin convection profile (purple) over bulk flow velocity streamlines and shear rate profile (f). Shear rates below 30 s−1 were subtracted from the shear rate heat maps on the overlays (d and f) for visibility of velocity streamlines.

