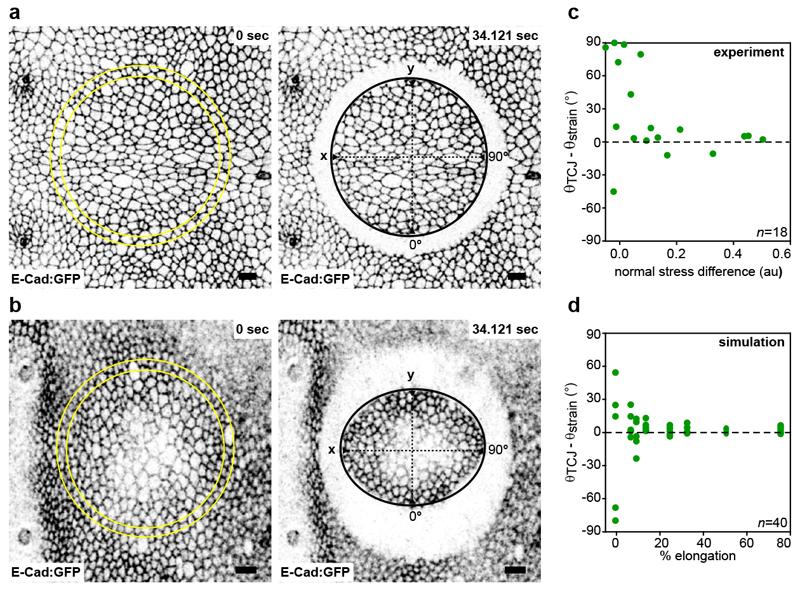
Extended Data Figure 10. TCJ bipolarity aligns with mechanical stress.
(a,b) Images of the scutellum tissue before and after ablation (ablated region in yellow) in early and late pupa characterized by small isotropic stress (a) and high anisotropic stress (b). Tissue stress was estimated by determining the initial recoiled velocity upon circular ablation in the x and y directions53. First and last images of two time-lapse movies out of the 18 quantified in c are shown. Scale bars: 10μm (a, b).
(c) Plot of the difference between the orientation of TCJ bipolarity (θTCJ) and principal strain axis (θstrain) as a function of normal stress differences (σyy – σxx, note that σxy = 0) as estimated up to a prefactor by circular laser ablation. Number of ablations (n) analysed is indicated. The same plot is shown in Fig. 4D.
(d) Plot of the difference between the orientation of TCJ bipolarity (θTCJ) and the orientation of strain (θstrain) as a function of the percentage of cell elongation applied to a simulated cell lattice. When cell elongation increases TCJ bipolarity orientation becomes aligned with the direction of cell elongation. Number of simulations (n) analysed is indicated.

