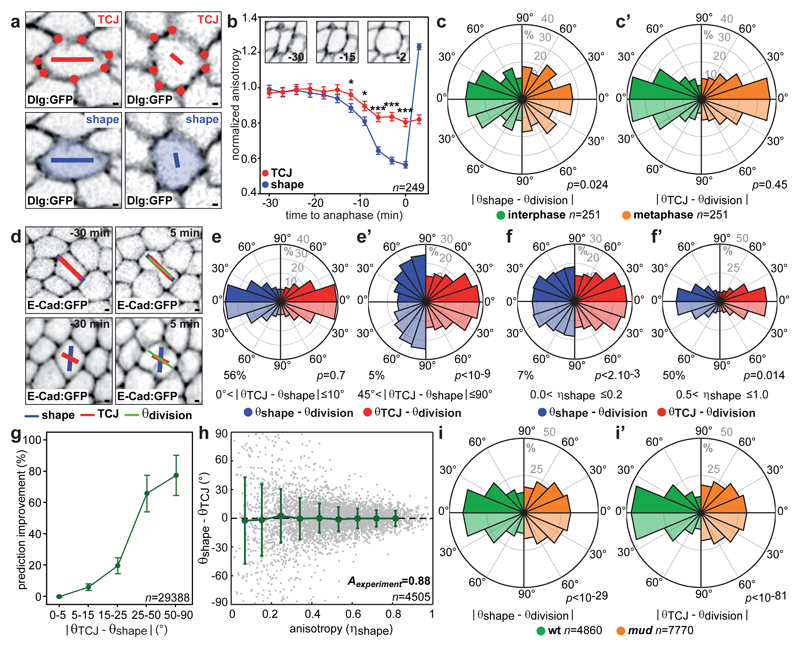
Fig. 3. TCJ distribution accounts for division orientation along the interphase cell shape.
(a) TCJ (red dots) bipolarity and cell shape (blue) anisotropies η and orientations θ represented by the length and orientation of red and blue bars.
(b) ηTCJ and ηshape from interphase to anaphase (mean±s.e.m). Insets: time-lapse images of a cell from interphase to mitotic rounding (n=249 cells). t-test (*:p<0.05, ***:p<0.0005).
(c-c’) Difference between experimental (θdivision) and predicted division orientations by the average (-20 to -10min interphase, -4 to -3min metaphase) cell long-axis (θshape) (c) or TCJ bipolarity (θTCJ) (c’). Kolmogorov-Smirnov test (p values).
(d) Top: θshape and θTCJ align with θdivision. Bottom: only θTCJ aligns with θdivision. Time-lapse images of 2 cells out of the 29388 cells analysed.
(e-f’) Difference between experimental (θdivision) and predicted division orientations based on interphase TCJ bipolarity (θTCJ) or cell long-axis (θshape) for |θTCJ – θshape| intervals (e-e’) and indicated ηshape intervals (f-f’). Kolmogorov-Smirnov test (p values), percentage of 29388 cells.
(g) TCJ bipolarity (θTCJ) prediction improvement over cell long-axis (θshape) versus |θTCJ – θshape|. mean±s.e.m of three movies for a total of n=29388 cells analyzed.
(h) Differences (mean±s.d.) between θshape and θTCJ versus ηshape. Correlation coefficient Aexperiment = 0.88.
(i-i’) Difference between experimental (θdivision) and predicted division orientations based on interphase cell long-axis (θshape) (left) or the TCJ bipolarity (θTCJ) (right) in wt and mud cells. Kolmogorov-Smirnov test (p values).
Scale bars: 1μm (a, b), n: cell numbers (b, g, h).

