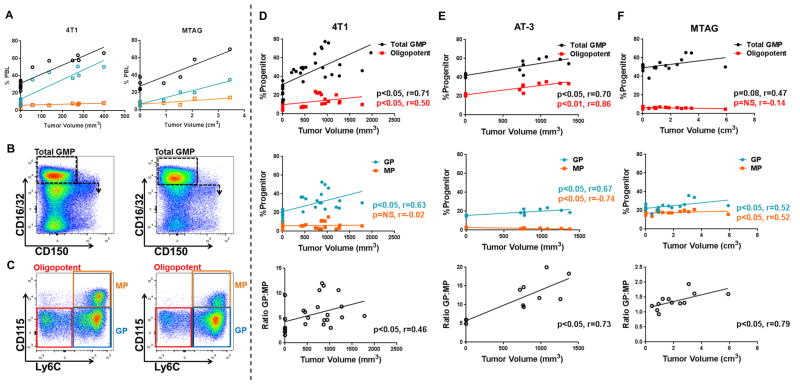
Figure 1. Myeloid progenitors in the bone marrow are altered during tumor growth.
(A) Percentages of total myeloid cells (CD11b+ cells; black lines) or the granulocytic (Gr-1hiCD115−; blue lines) or monocytic fractions (Gr-1intCD115+; orange lines) from the peripheral blood of 4T1 tumor-bearing (left) or MTAG (right) mice plotted in relation to tumor volume (each point is a measurement from an individual mouse). (B) Gating strategy used for total GMPs (NTB: 35.6% vs. 4T1: 65.4%) and newly defined downstream progenitor subsets, oligopotent GMPs (NTB: 22.8% vs. 4T1: 14.2%), GPs (NTB: 53.2% vs. 4T1: 73.2%), MPs (NTB: 22.5% vs. 4T1: 11.8%) (C) from bone marrow of NTB (left) and 4T1 (right) tumor-bearing mice. Progenitor populations were calculated as a percentage of the Lin−cKit+Sca-1− gate and plotted by tumor volume with total and oligopotent GMPs (top), GPs and MPs (middle) and GP:MP ratio (bottom) for the 4T1, AT-3 and MTAG models (D – F, respectively). 4T1, AT-3 and MTAG data compiled from multiple experiments. For D, n= 8 for NTB or n=24 for 4T1; E, n=3 for NTB or n=8 for AT-3; F, n= 7 for WT or n=12 for MTAG.

