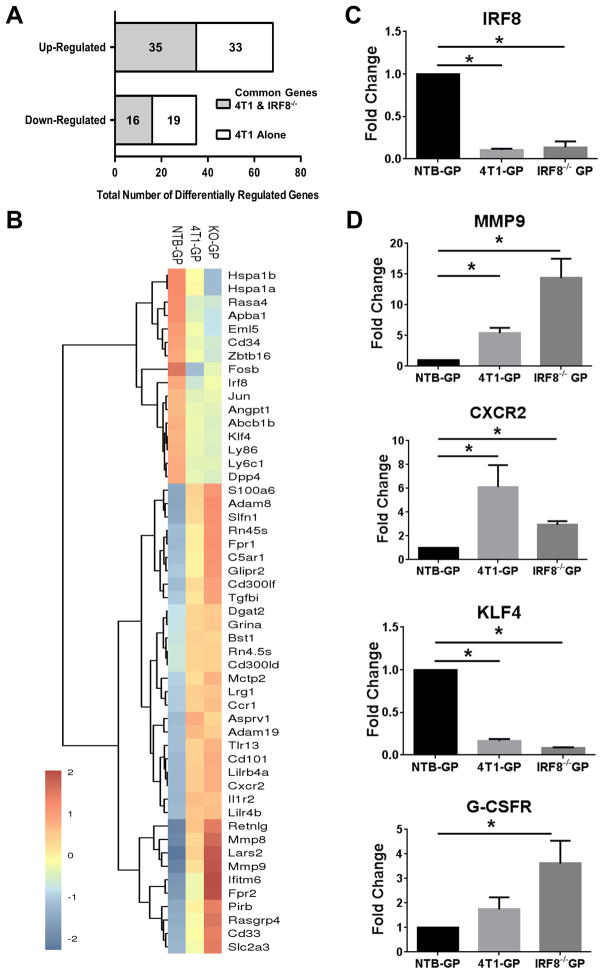
Figure 5. Tumor-induced GPs share a gene expression profile with IRF8−/− GPs.
(A) Data showing the number of differentially regulated genes (> 2-fold up or down) common to 4T1-GPs and IRF8−/−-GPs (gray area) or limited to 4T1-GPs (white area) compared to GPs of NTB mice. (B) Heat-map of genes in A, along with cluster analysis for NTB-, 4T1- and IRF8−/−-GPs. (C) qRT-PCR validation of IRF8 levels in the indicated GP populations. (D) qRT-PCR analysis of the indicated genes associated with MDSC biology from NTB-, 4T1- or IRF8−/− sorted GPs. All values normalized to GPs of NTB mice. *p<0.01 for 3 or more technical replicates using RNA from the RNA-seq analysis.

