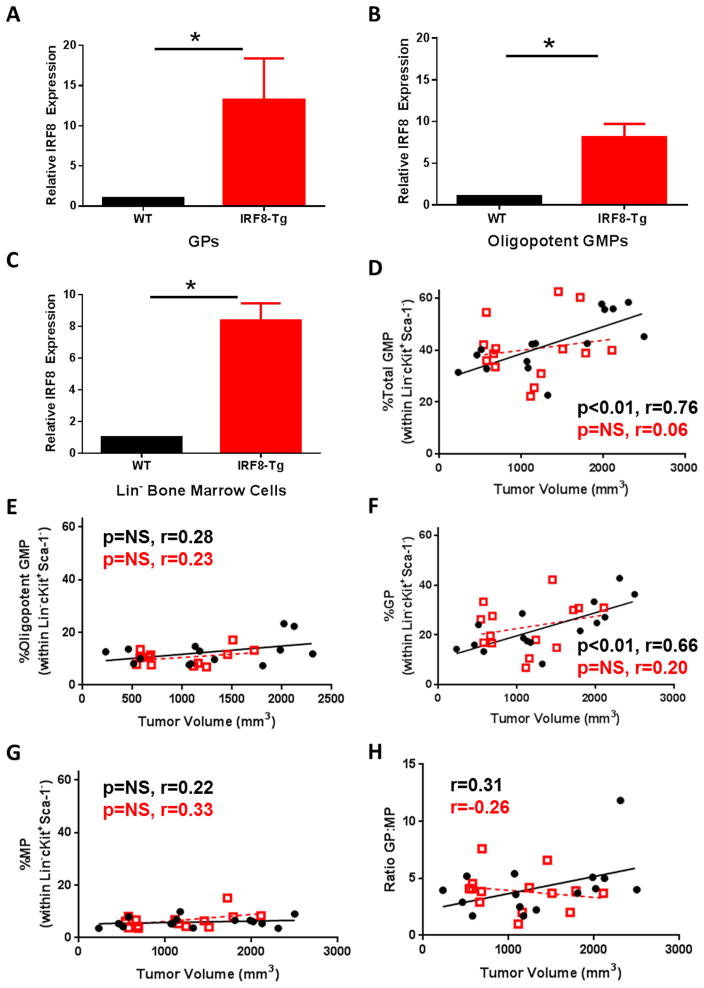
Figure 7. Enhanced IRF8 expression restrains GP production.
Quantitative RT-PCR analysis of IRF8 levels in sorted GPs (A), oligopotent GMPs (B) or lineage-depleted bone marrow cells (C) of naïve WT or IRF8-Tg mice. (D–H) WT (n=15) (black circles) or IRF8-Tg (n=14) (red squares) mice were implanted with AT-3 tumor cells, as in Fig. 1. Bone marrow progenitor cell analysis was performed, as described earlier. Frequency of total GMPs (D), oligopotent GMPs (E), GPs (F) and MPs (G) plotted in relation to tumor volume and trend lines generated by linear regression analysis. (H) Ratio of GPs to MPs was also calculated. (D–H) P-values based on Spearman correlation of the individual lines. Data compiled from three experiments whereby each data point is from an individual mouse.

