Figure 7.
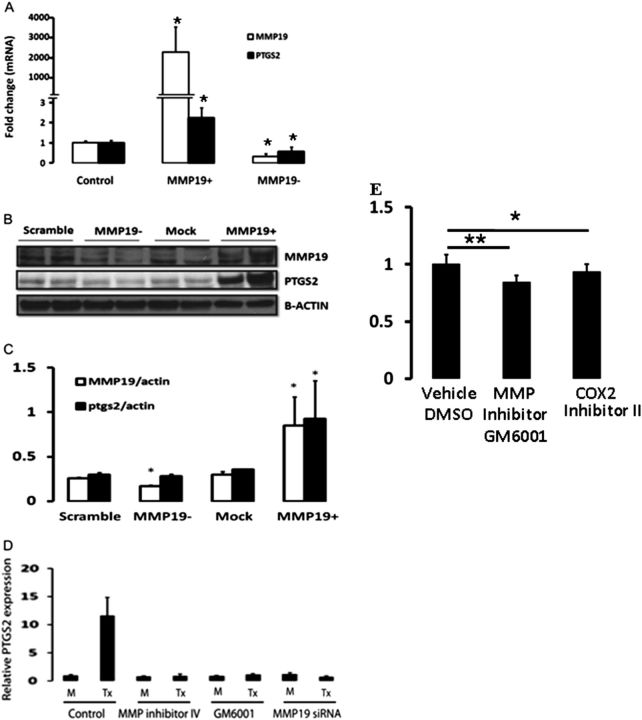
Matrix metalloproteinase (MMP)19 regulation of PTGS2 (prostaglandin–endoperoxide synthase 2) expression in A549 cells. A549 cells were transfected with full-length cDNA or siRNA of MMP19 and harvested 24 hours after the treatment. (A) MMP19 and PTGS2 mRNA levels were measured by quantitative reverse transcriptase–polymerase chain reaction (qRT-PCR) (MMP19: MMP19+ vs. control, *P = 6.23 × 10⁻⁶; MMP19− vs. control, *P = 0.0004; PTGS2: MMP19+ vs. control, *P = 0.0002; MMP19− vs. control, P = 0.04). (B) MMP19 and PTGS2 protein by Western blot analysis in homogenates of A549 cells. (C) Densitometric analysis of the Western blot shown in B. MMP19 versus scramble, *P = 0.03; MMP19+ versus mock, *P = 0.004; PTGS2 (MMP19+) versus mock, *P < 0.007. (D) PTGS2 mRNA levels quantified by qRT-PCR. RNA was extracted from A549 cells 24 hours after transiently transfected with MMP19 that were pretreated with PBS, MMP inhibitors (GM6001 and MMP inhibitors IV), and MMP19 siRNA transfection for 6 hours. Y-axis: fold expression over mock transfection. Data represent mean ± SEM of three experiments. (E) A549 cell migration was attenuated by the MMP inhibitor GM6001 as well as the specific PTGS2 inhibitor, COX-2 inhibitor II, a cell-permeable isoxazolyl-benzenesulfonamide compound; *P < 0.05; **P < 0.01. DMSO = dimethyl sulfoxide.

