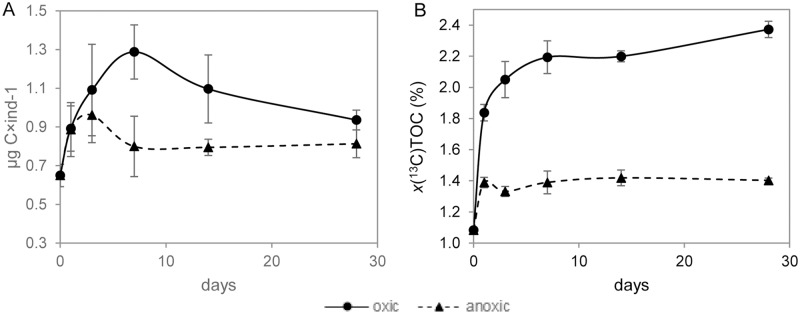
Fig 1. TOC concentration and 13C atomic fraction of A. tepida under oxic and anoxic conditions.
(A) Average total organic carbon (TOC in μg C×ind-1) concentration and (B) 13C atomic fraction of the TOC (x(13C)TOC in %), both as a function of time. Continuous lines: oxic conditions, dotted lines: anoxic conditions. Error bars are ±1 SD (n = 3).

