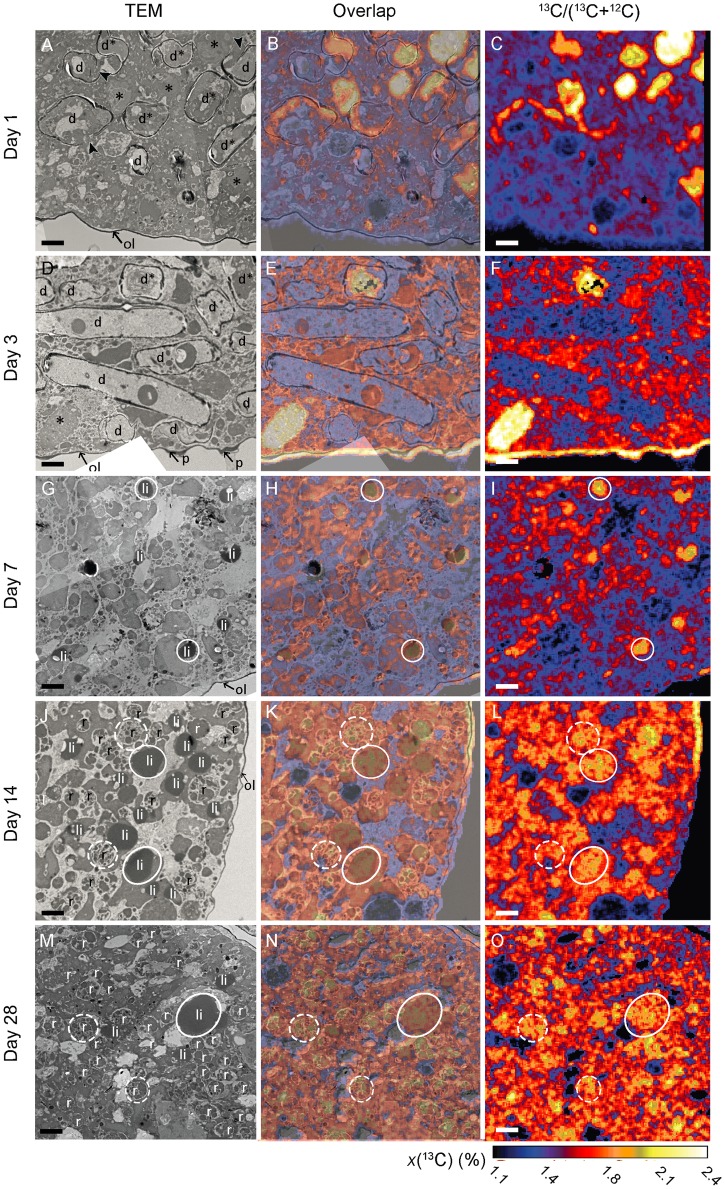
Fig 2. Time-evolution of 13C uptake and transfer within the cytoplasm of A. tepida under oxic conditions.
A, D, G, J and M: TEM images; C, F, I, L and O: NanoSIMS images of corresponding 13C/12C distributions. B, E, H, K, and N: Direct correlation of TEM and NanoSIMS images. d*: Intact diatoms; d: frustules without their original contents; *: diatomic material free in the foraminiferal cytoplasm; li: lipid droplets; ol: organic lining; p: pores; r: residual bodies. Arrowheads show aperture of opened diatom frustules. Circles are drawn around a few organelles to facilitate their visualization on the different images: white circles: lipid droplets, dotted circles: residual bodies. Scale bars: 2 μm.

