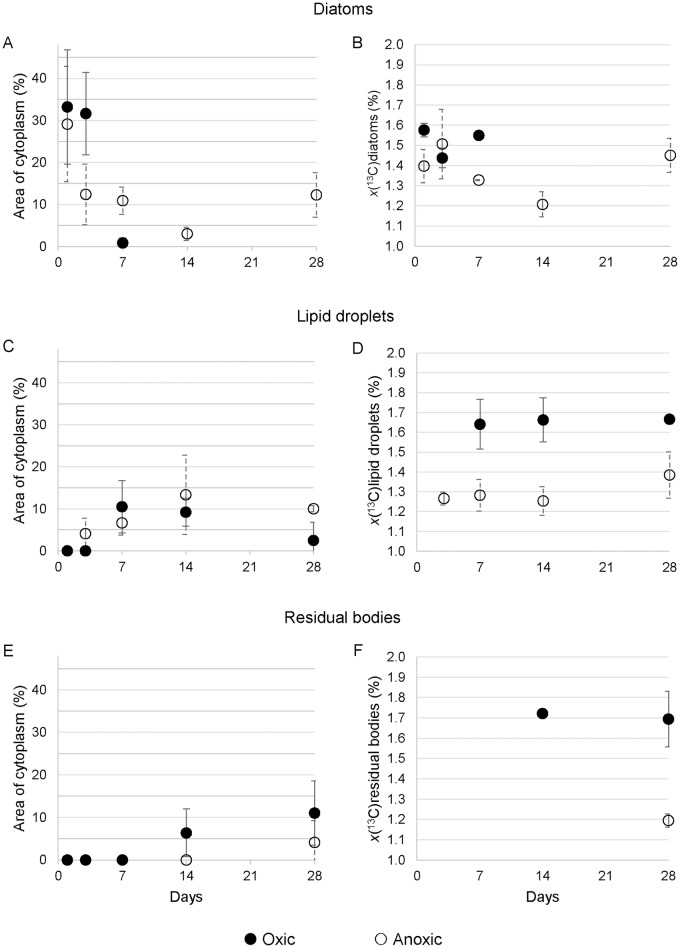
Fig 4. Percentages of cytoplasmic occupation and 13C atomic fraction of key cell ultrastructures.
Percentage of occupation of cytoplasm area (A, C and E) and 13C atomic fraction (x(13C) in %; B, D and F) over time for key components in A. tepida: A, B: diatoms; C, D: lipid droplets; E, F: residual bodies. Errors bars are ±1 SD (n = 3).

