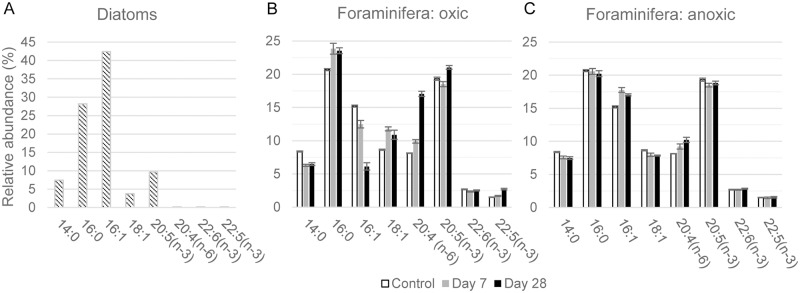
Fig 5. Relative abundances (%) of the dominant fatty acids extracted from the biofilm of diatoms and in A. tepida endoplasm.
Relative abundances (expressed in %) of the eight dominant FAs extracted from the biofilm of diatoms and in A. tepida individuals incubated under oxic (B) and anoxic (C) conditions, respectively. White: control specimens; grey: after Day 7 and black: after Day 28. Error bars are ±1 SD (n = 3).

