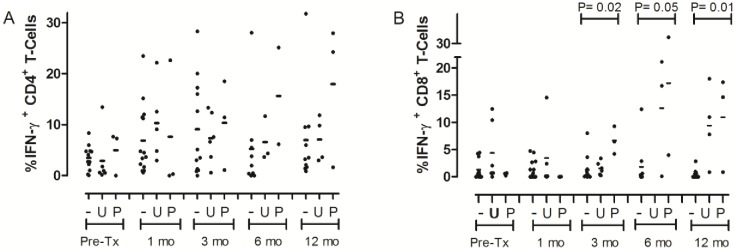
Fig 1. BKPyV specific (A) CD4+ and (B) CD8+ T-cells.
Line represents mean value. “-” = BK Negative, “U” = viruria, “P” = viremia, “mo” = months post-transplant. “Pre-Tx” = Pre-transplant. P values were calculated by Kruskall-Wallis comparing all 3 groups at each time point. A: No significant difference at any time point. B: 3 month mean %IFN-γ producing CD8+ T-Cells for BK negative 1.29 (±2.36), viruria 1.54 (±1.21), viremia 6.67 ±0.54), P = 0.02; 6 months mean for BK negative 1.81 (±4.10), viruria 12.65 (±11.10) and viremia 17.22 (±18.68), P = 0.05; 12 months mean for BK negative 0.53 (±0.91), viruria 9.44 (±7.13), viremia 10.97 (±8.85), P = 0.01.

