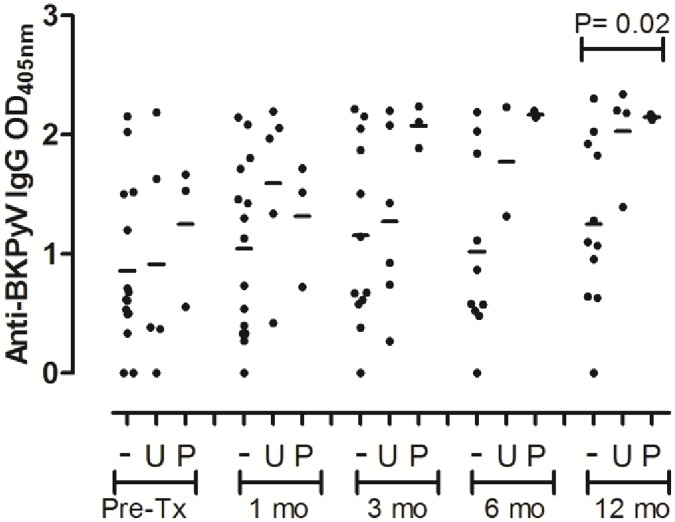
Fig 3. Anti-BKPyV IgG.
Line represents mean value. “OD” = Optical Density, “-” = BK Negative, “U” = viruria, “P” = viremia, “mo” = months post-transplant. “Pre-Tx” = Pre-transplant. P values were calculated by Kruskall-Wallis comparing all 3 groups at each time point. 12 month mean for BK negative 1.25 (± 0.70), viruria 2.03 (± 0.43), viremia 2.15(± 0.02), P = 0.02.

