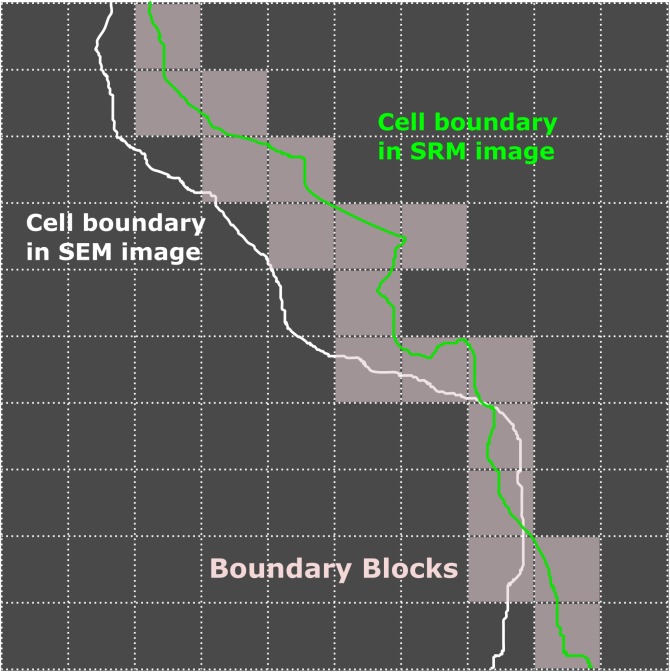
Fig 1. Schematics for quantitating morphological changes in correlative SRM and EM images.
After image registration, cell boundaries in both SRM (green) and SEM (white) images are defined, for example with custom Matlab scripts. The SRM image is also divided into 100 x 100 nm2 blocks. The difference in cell areas are then calculated and normalized to the contour length determined by counting the number of blocks (gray) along the cell boundary in the SRM image (green). As such, both the area difference and contour length have the units of nm2.

