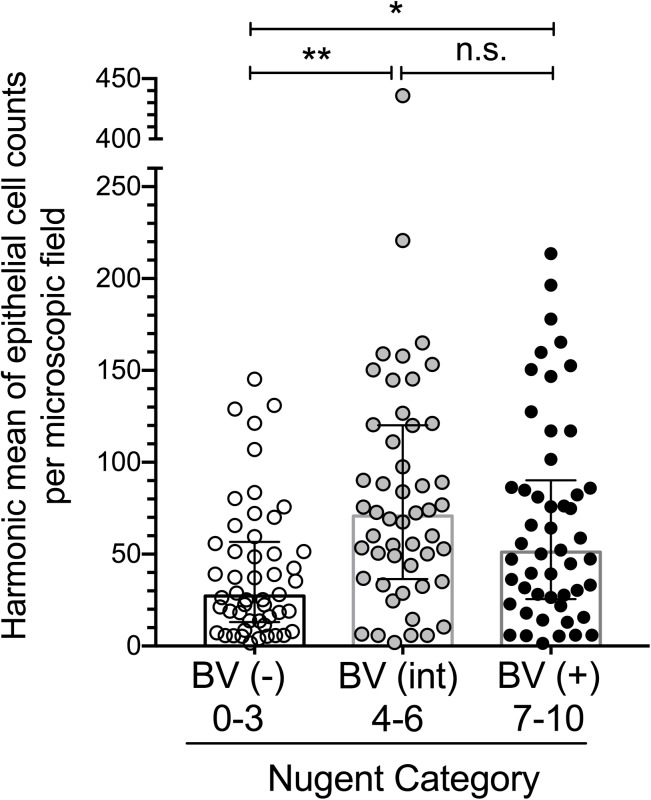
Fig 1. Relationship between Nugent score and epithelial exfoliation.
Number of exfoliated epithelial cells by Nugent-defined BV group (negative, intermediate, and positive) is plotted as the harmonic mean of six counts from two observers. “Int.” = intermediate; “ns” = not significant. The central tendencies and error bars shown are medians and interquartile ranges respectively. The Friedman test (P < 0.01) was used to compare differences between groups, followed by Dunn’s multiple comparison post hoc test (** P < 0.01, * P < 0.05).

