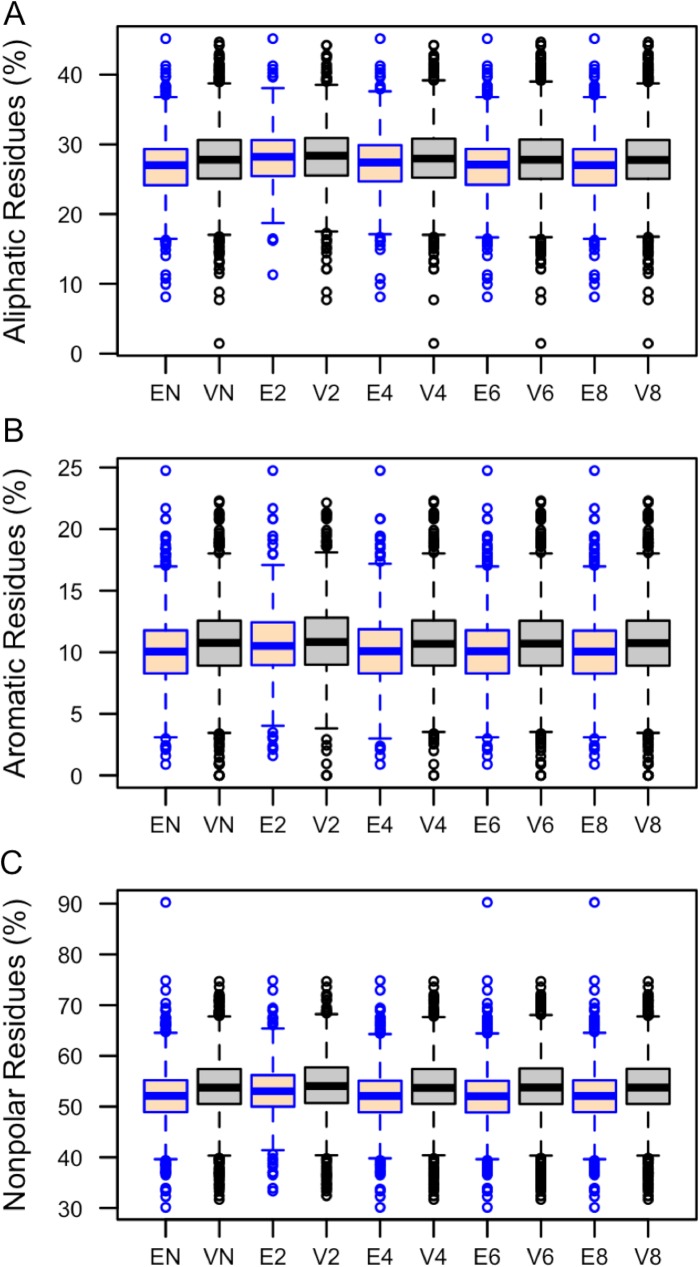
Fig 6.
Distributions of (A) aliphatic, (B) aromatic, and (C) non-polar residues (%) between essential and viable proteins. Here, EN and VN refer to essential and viable genes in the non–culled dataset. Ex and Vx define essential and viable genes in the culled dataset where all coded proteins share sequence similarity less than x0%. In this box plot, the top and bottom of the box denote the upper and lower quartiles; the line inside the box denotes the median; and individual points denote the outliers.

