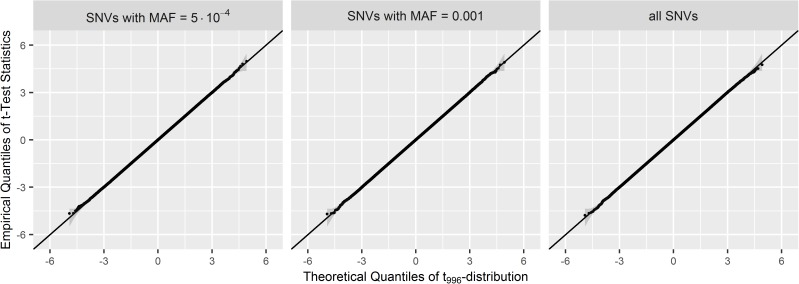
Fig 1. Quantile-quantile plots of SMT statistic values for singletons, doubletons, and all SNVs.
Datasets were generated from the null model described in scenario 0 in Table 1 of size n = 1,000 for m = 10,000,000 replicates. Quantile-Quantile plots are shown comparing the empirical quantiles of the t-test statistics of singletons (left panel), doubletons (middle panel), and all SNVs (right panel) to the theoretical quantiles of the tdf = 1000–4 distribution. For computational purposes, each plot is based on a random sample of 1,000,000 t-test statistics, out of the 132,797,000 t-test statistics of all singletons in all replicates, out of the 41,341,000 t-test statistics of all doubletons in all replicates, and out of the 325,393,000 t-test statistics of all SNVs in all replicates. In grey ribbons, approximate 95% point-wise confidence intervals are shown.

