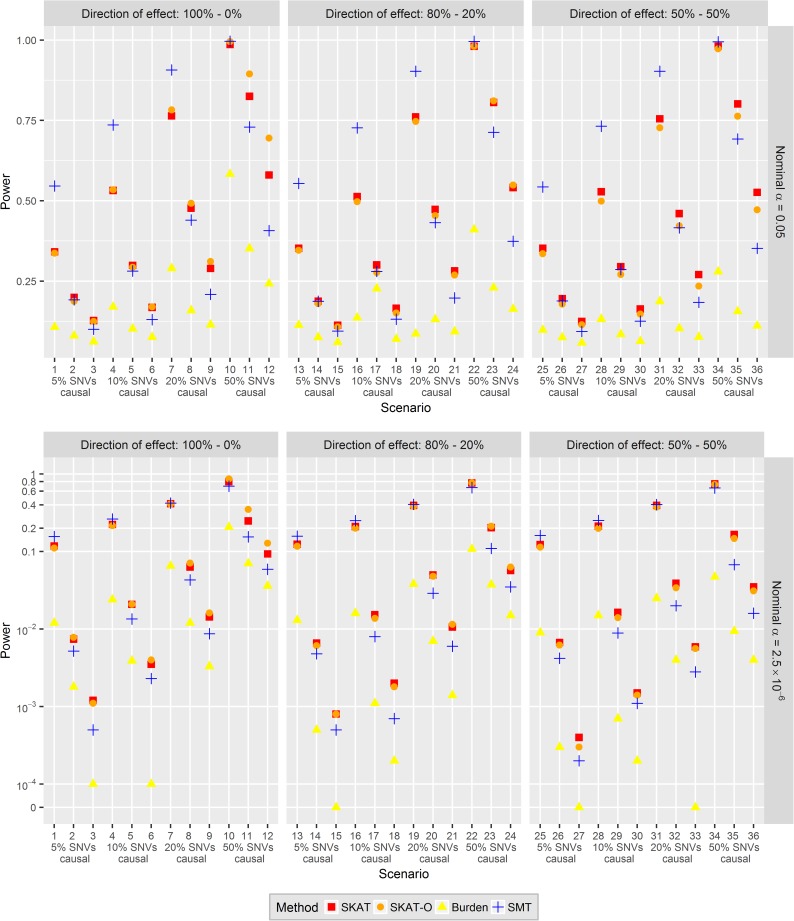
Fig 2. Power estimates of the SMT and MMTs.
Data was generated under an alternative-hypothesis model described in scenarios 1–36 in Table 1 of size n = 1,000 for m = 10,000 replicates. The nominal α was set to 0.05 (upper panel) and 2.5∙10−6 (lower panel). In the lower panel with α = 2.5∙10−6, the coordinate system is shown on a log10-scale to better visualize the small power differences between the approaches. Multiple testing corrections for the SMT of all SNVs in a gene were done using the BH-correction.

