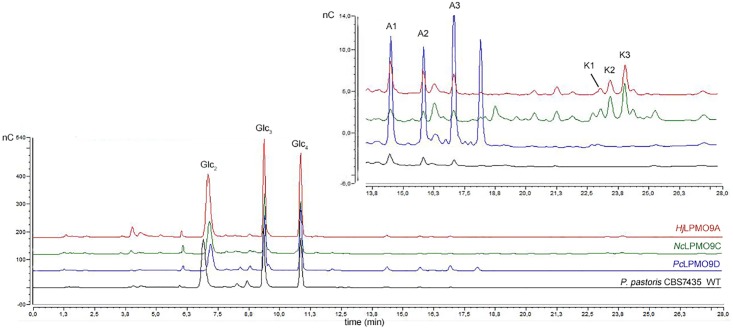
Fig 2. HPAEC-PAD chromatograms of all 3 LPMO representatives.
Activity of HjLPMO9A (red), NcLPMO9C (green), PcLPMO9D (blue) and wildtype P. pastoris CBS7435 broth (black) on 0.5% PASC in the presence of 1 mM ascorbic acid as reducing agent. The six signals (A1-3 and K1-3) that will be evaluated for their use as indicator signal are indicated in the top chromatogram.

