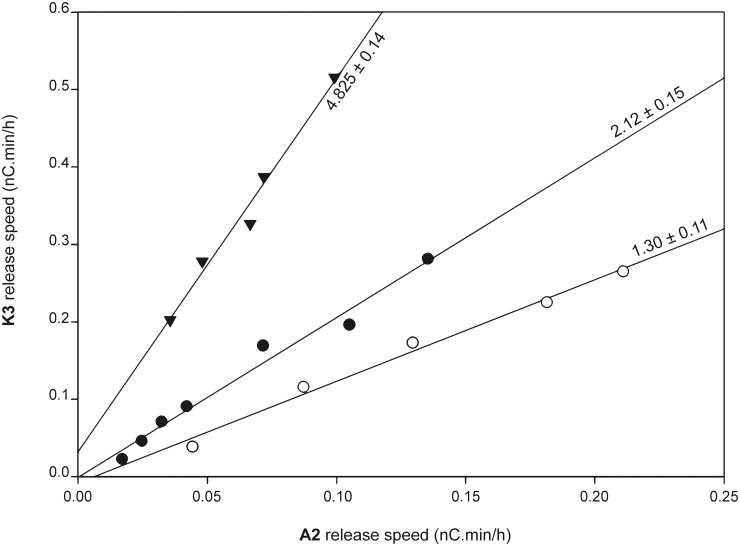
Fig 6. Indicator diagram demonstrates role of aromatic residues in LPMO regioselectivity.
Slopes, which are a measure of the ratio of C4/C1-oxidation, are listed next to the regression line, together with their standard deviation. ● = HjLPMO9A wildtype (1.4–14 μM), ○ = Y24A variant (1.2–12 μM), ▼ = Y211 (1.2–12 μM) variant.

