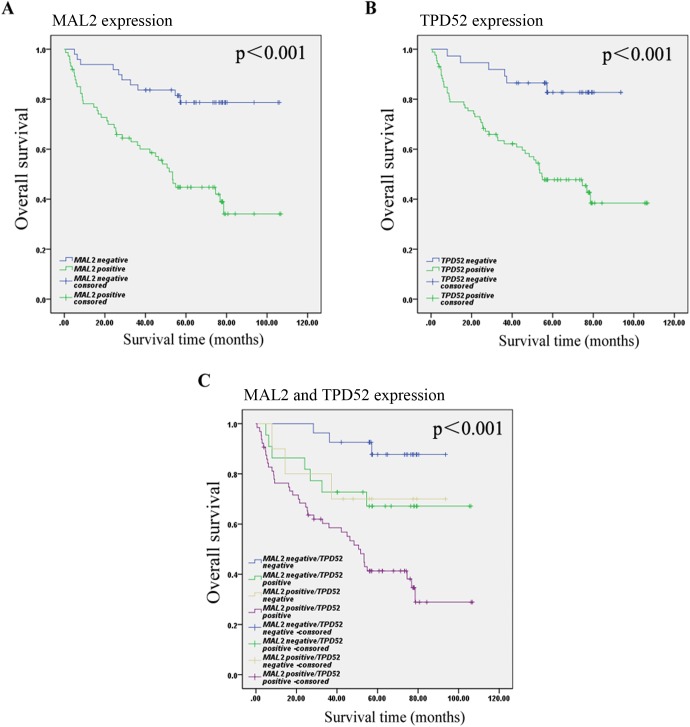
Fig 4. Kaplan-Meier survival analysis in patients with CRC.
(A) Overall survival curves for patients according to the negative (n = 49) and positive (n = 74) expression levels of MAL2 of immunohistochemical variables in tumor cells. (B) Overall survival curves for patients according to the negative (n = 37) and positive (n = 86) expression levels of TPD25 of immunohistochemical variables in tumor cells. (C) Overall survival curves for patients according to the positive and negative expression of MAL2 and TPD52 of immunohistochemical variables in tumor cells.

