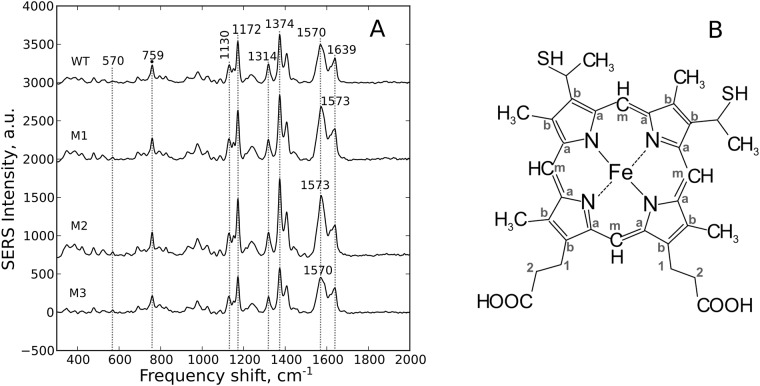
Fig 3. SERS study of oxidized cytochromes.
(A) The SERS spectra of the studied cytochromes in the oxidized state: WT—wild type; M1—T78N/K79Y/M80I/I81M/F82N, M2—T78S/K79P, M3—I81Y/A83Y/G84N. For clearer presentation, the spectra are shifted in vertical position. Numbers above peaks indicate positions of their maxima used in the analysis. X axis is a frequency shift, cm-1; Y axis is SERS intensity, a.u. (B) Structural formula of heme c with numeration of C atoms.

