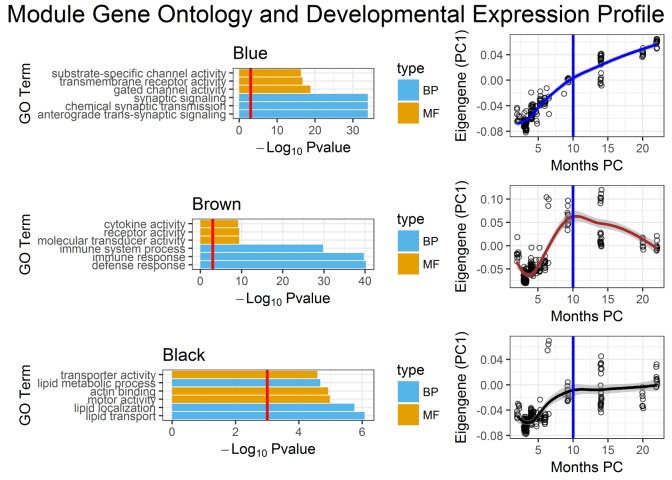
Fig 4. Characterization of modules enriched for differentially expressed lncRNAs.
Gene Ontology functional enrichment was analyzed for each module and adjusted for multiple comparisons (FDR < 0.05). The scatterplots show modular developmental expression profiles based on a module eigengene (1st principal component) through developmental time, months PC means months post-conception (2 months post-conception to 1 post-natal year), with the blue vertical line demarcating birth. The trend line of each scatterplot is derived from a locally weighted scatterplot smoothing function.

