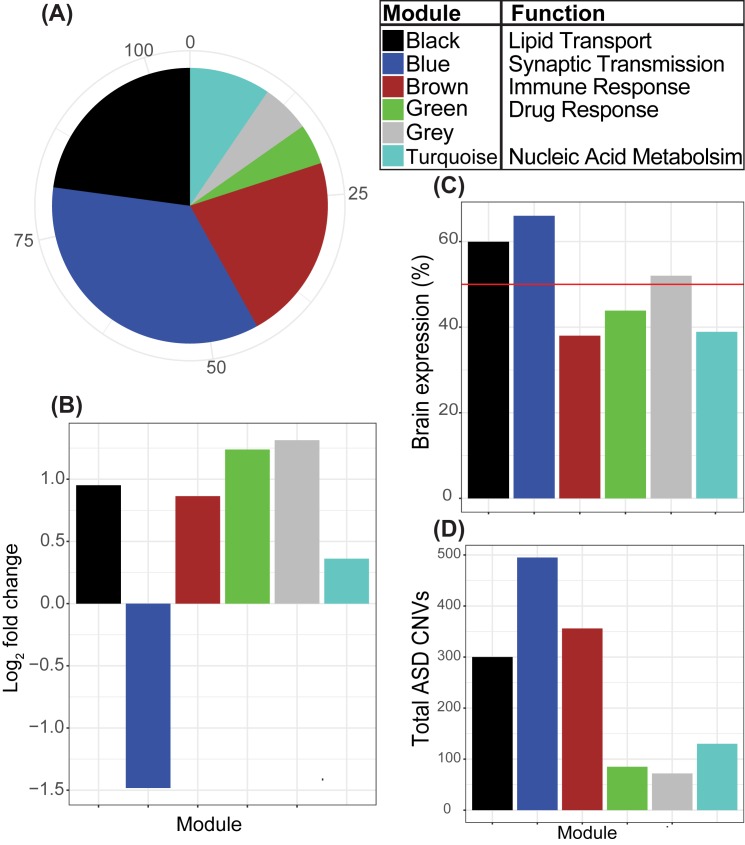
Fig 5. Candidate ASD-associated lncRNA characteristics.
(A) Module assignment for differentially expressed lncRNAs. Only modules with at least 4 lncRNAs are displayed. In addition, we provide the module function, which is the highest scoring GO biological process for the whole module. (B) Average log2 fold change of expression in the ASD cortex for the differentially expressed lncRNAs from each module. (C) Average fractional expression levels in the brain for the differentially expressed lncRNAs from each module. Fractional brain expression for each lncRNA is calculated using the RNA-seq data from the Genotype-Tissue Expression project as the total expression in brain tissues divided by the sum of expression across all tissue types [28]. The red line at 50% represents the threshold for tissue specificity as defined by Ayupe et al [36]. (D) Overlaps between ASD CNVs and DE lncRNAs from each module.

