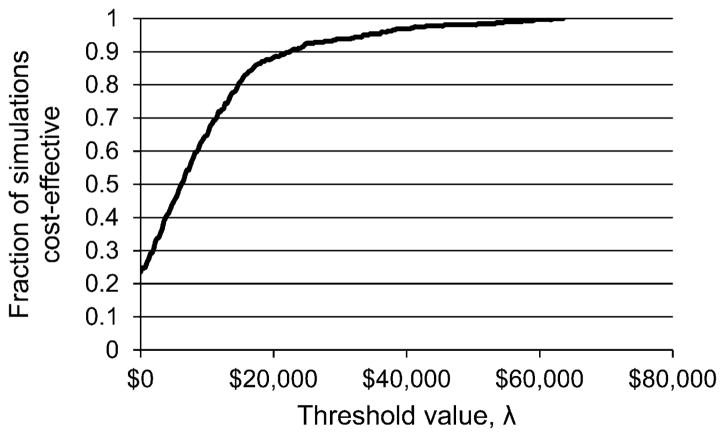
Figure A.2.
Health system perspective acceptability curve for the multivariate sensitivity analysis from Table A.11. Curve shows the fraction of sensitivity runs that were cost-effective from the health system perspective for each threshold value λ (the fraction of simulations for which the incremental cost per QALY gained by 3HP compared to 9H was ≤λ). Each run represents one of the 324 combinations of parameters from Table A.11 and was simulated using 50 000 individuals for each regimen. QALY = quality-adjusted life years; 3HP = 12-dose regimen of weekly rifapentine plus isoniazid; 9H = 9 months of daily, self-administered isoniazid.

