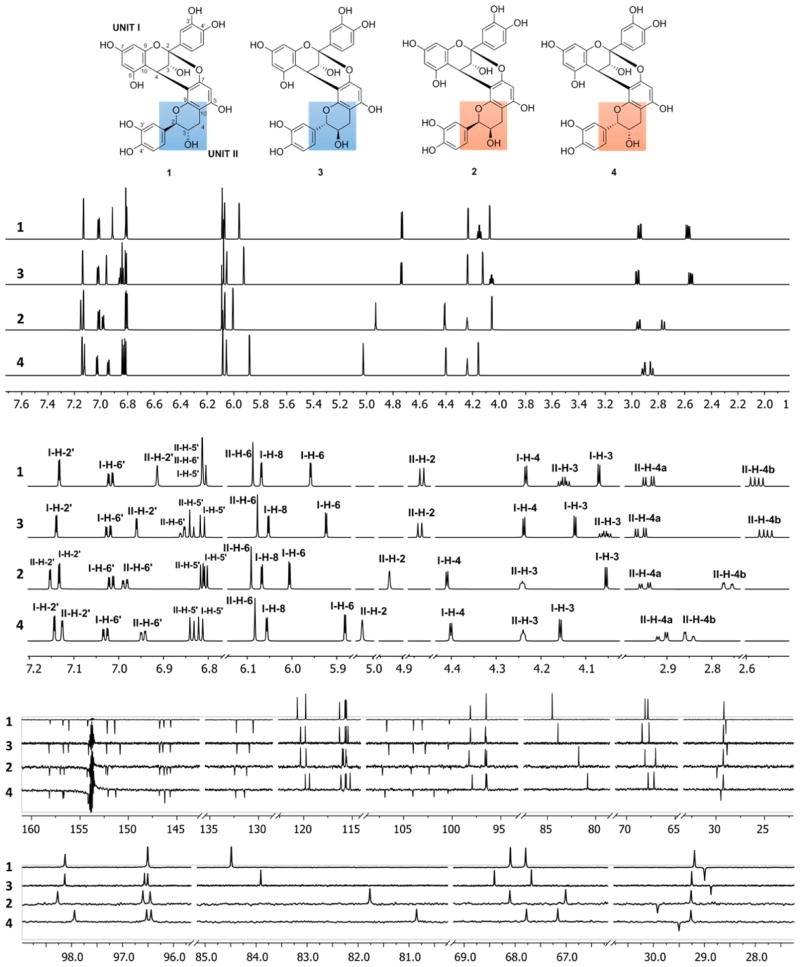
Figure 4.
Full and expanded plots of the 1H NMR (HiFSA fingerprints; 900 MHz) and 13C DEPTQ (225 MHz) NMR spectra of the dimeric OPACs 1–4. The structures at the top show the distinctive stereochemical features of 1–4 marked in ring F. The out-of-phase signals at ~154 ppm are solvent image artifacts that are common in high dynamic range DEPTQ spectra.

