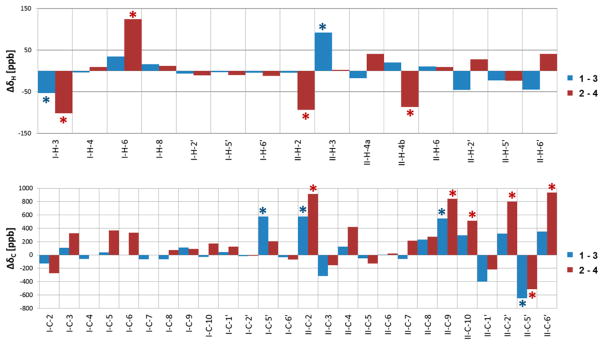
Figure 5.
Graphical representation of the 1H and 13C chemical shift differences (Δδ) between the diastereomeric pairs 1/3 (blue) and 2/4 (red) expressed in ppb. 1H and 13C NMR data were acquired in CD3OD at 298 K and at 900 and 225 MHz, respectively. The chemical shift differences of C-3′ and C-4′ were excluded due to their interchangeable assignments. Asterisks denote diagnostic Δδ values that allow differentiation between the diastereomeric pairs 1/3 and 2/4.

