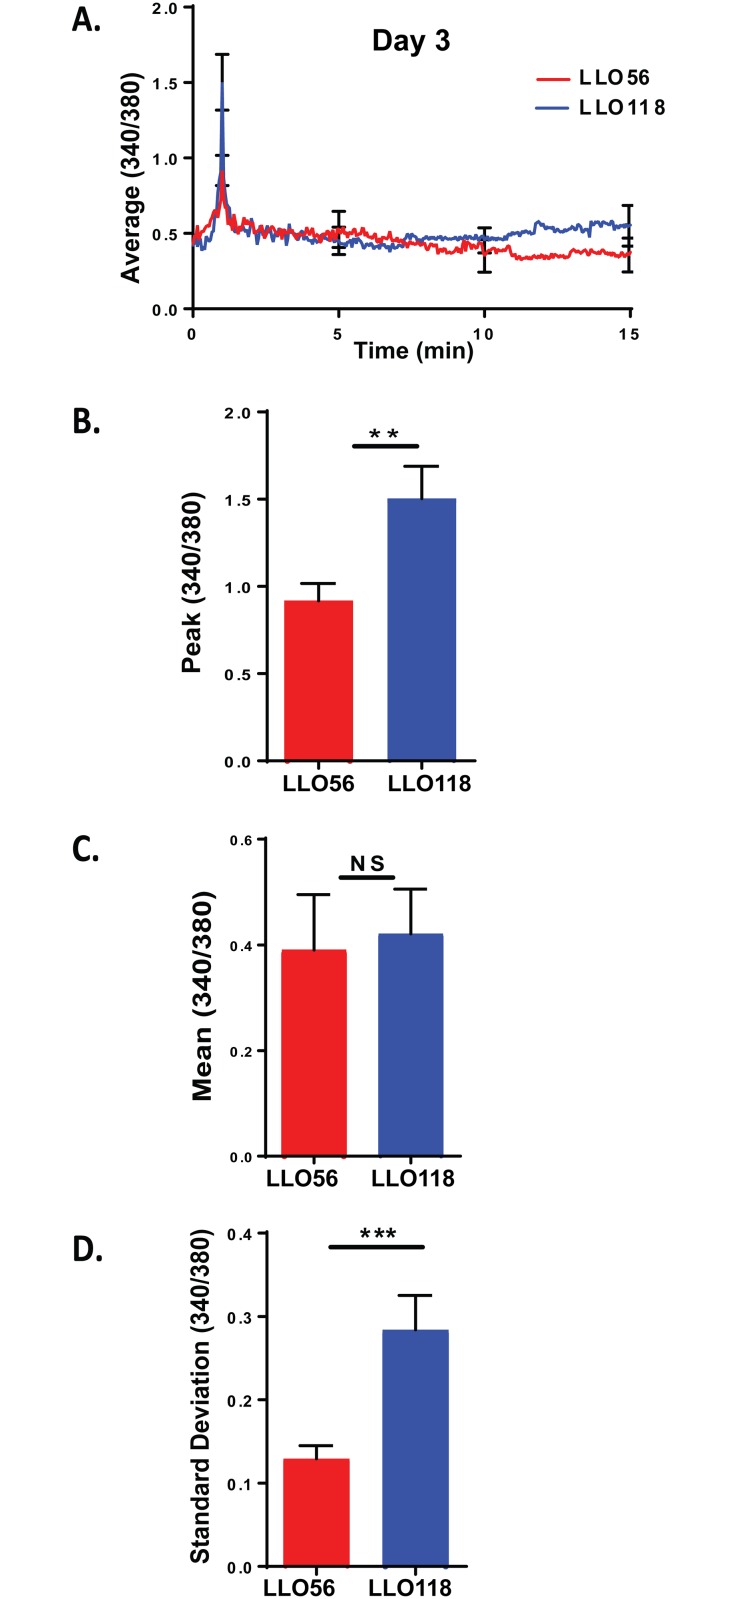
Fig 3. LLO118 helper T cells have higher calcium signaling on day 3 post stimulation.
LLO56 and LLO118 splenocytes were isolated and cultured with the LLO190-205 peptide from L. monocytogenes for 72 hours in vitro. 24 hours before live imaging, a second set of splenocytes were isolated and cultured in an 8-chamber slide loaded with LLO190-205 peptide of L. monocytogenes for use as antigen presenting cells. T cells were stained with Fura-2AM, added to the antigen presenting cells and Ca2+ influx was measured. A. Average curves of intracellular Ca2+ mobilization from stimulated LLO56 and LLO118 splenocytes (340/380 ratios; n = 30) on day 3 post stimulation. Error bars show the SEM at the influx peak. B. Statistical analysis of peak calcium influx of stimulated LLO56 and LLO118 naïve T helper cells (n = 30+). C. Statistical analysis of the sustained intracellular Ca2+ levels (Average 340/380 values between minutes 5 and 20) after initial stimulation response (n = 30+). D. Standard deviation was determined by linear regression analysis and shows variability in the calcium signal for each group (n = 30+). (** = p < .01; *** = p < .001; NS = not significant).

