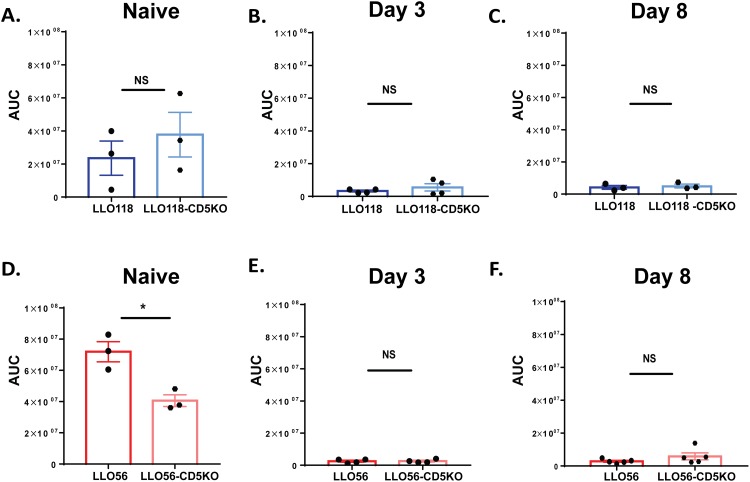
Fig 6. CD5 expression in naïve LLO56 T helper cells is correlated with higher Ca2+ mobilization.
Flow cytometry analysis was performed to determine Ca2+ mobilization levels in LLO56, LLO118, LLO56-CD5 knockout and LLO118-CD5 knockout T cells stimulated with the L. monocytogenes peptide (naïve, day 3, and day 8 time points). Calcium levels were quantified using the FlowJo kinetics tool to determine the area under the curve (AUC) for each sample (mean ± SEM). A-C. Statistical analysis of calcium mobilization of LLO118 and LLO118-CD5 knockout T cells stimulated with PMA/Ionomycin. Data is shown for naive (A), day 3 post stimulation (B) and day 8 post stimulation (C). D-F. Statistical analysis of calcium mobilization of naïve LLO56 and LLO56-CD5 knockout T cells stimulated with PMA/Ionomycin. Data is shown for naive (D), day 3 post stimulation (E) and day 8 post stimulation (F). (* = p < .05; NS = not significant).

