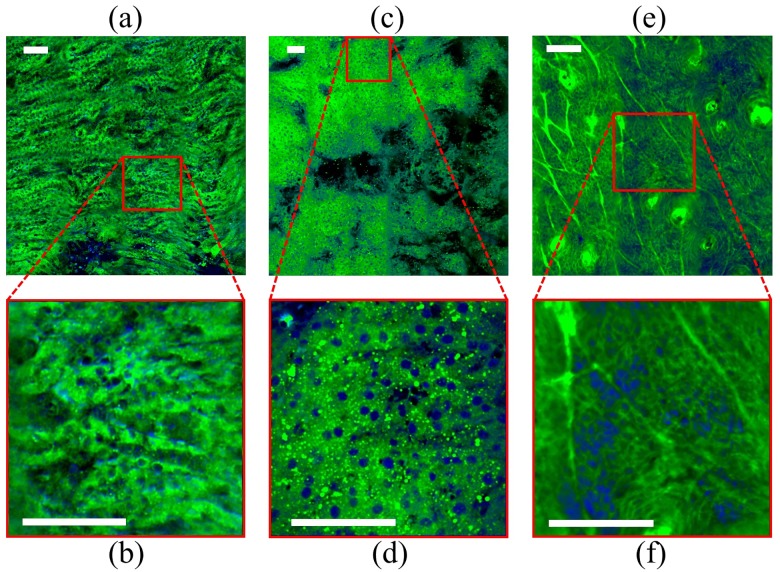
Fig 5. Broadband, femtosecond SRS imaging of mouse tissue using 40 cm-1 pulses.
The tissues shown are (a, b) kidney, (c, d) liver, and (e, f) skin. For each tissue, the above image is a larger field of view (FOV) and the below image is a smaller FOV indicated by the red outline. After unmixing, the images are color coded and merged; the proteins are colored blue and the lipids, green. Scale bars: 100 μm.

