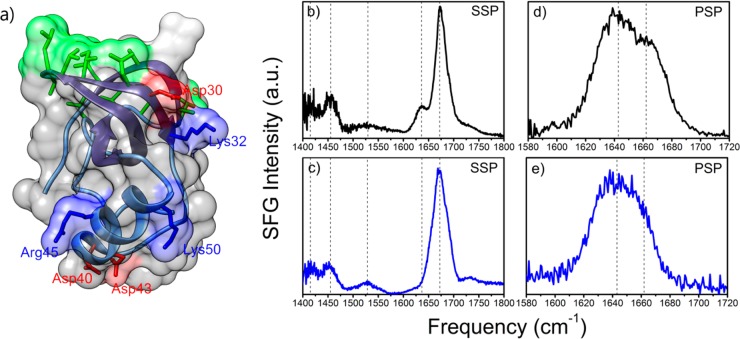
Figure 1.
Crystal structure of HFBI and VSFG spectra at the air–water interface of a 14 μM aqueous solution (pH 7) of HFBI (black) and HFBII (blue) at room temperature. (a). Hydrophobin three-dimensional structure that consists of a β-barrel core, a small α-helix, and a distinguishable hydrophobic patch (colored in green). Basic and acidic residues are annotated and highlighted in blue and red, respectively. (b,c) VSFG spectra of HFBI and HFBII in the SSP polarization (s-SFG, s-VIS, p-IR) contain several signals associated with the protein. (d,e) VSFG spectra of HFBI and HFBII in PSP polarization (p-SFG, s-VIS, p-IR) show signals centered at ∼1640 and ∼1660 cm–1 that are associated with the central β-barrel of hydrophobins.

