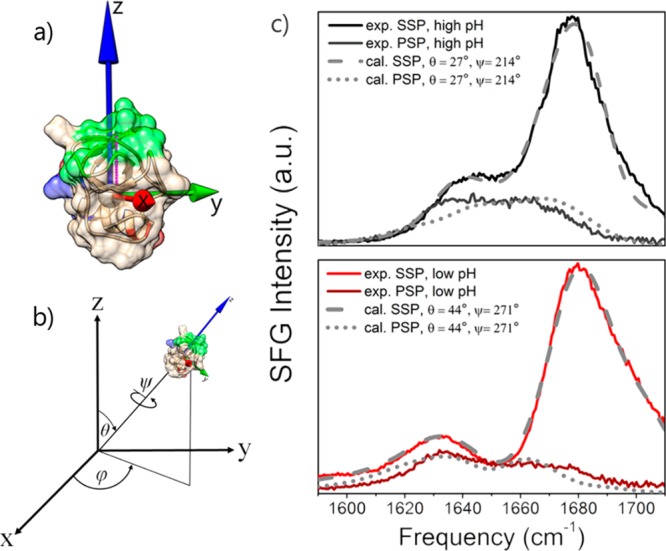
Figure 3.

Calculated VSFG spectra of HFBI. (a) Definition of the molecular axes of hydrophobin with the Z axis overlapping with the hydrophobic moment vector. (b) Euler angles (θ, φ, ψ) that transform the atom coordinates from the molecular to the lab frame and define the orientation of the hydrophobic vector (shown in magenta) of the protein. (c) Calculated VSFG spectra that best resemble the experimental data. The experimental acidic (red) and basic (black) pH spectra are reproduced best with (θ, ψ) = (26.8 ± 2.3°, 213.6 ± 5.3°) and (43.6 ± 10.4° and 271.0 ± 10.1°), respectively.
