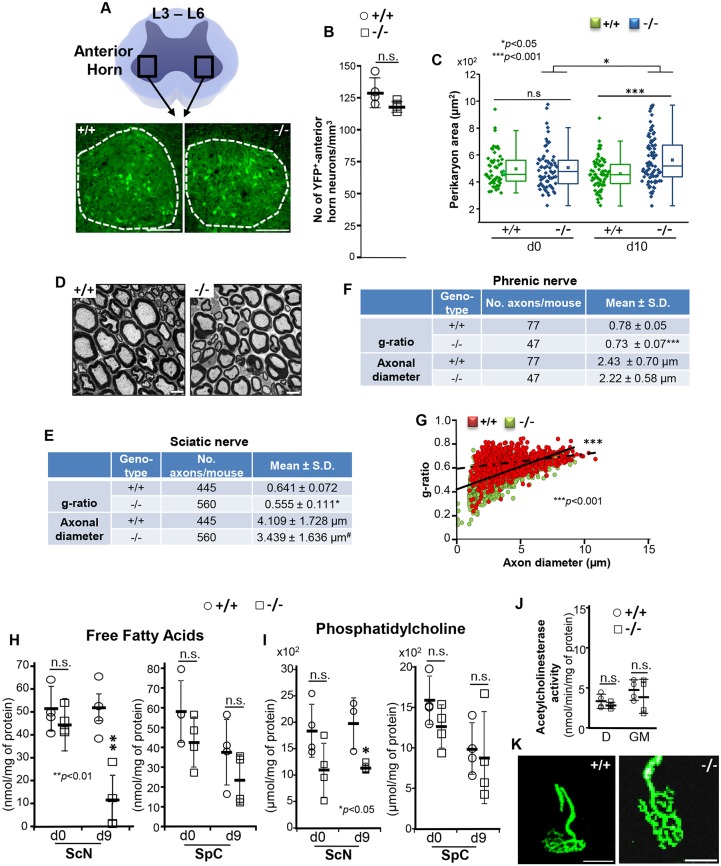
Fig. 3.
Morphometric and lipid compositional changes of motoneurons of SLICK-H::Ranbp2flox/flox mice. (A) Diagram (top) and representative low-power confocal images (bottom) of the anterior horn at lumbar 3-6 levels (L3-L6) of spinal cords of SLICK-H::Ranbp2+/+ (+/+) and SLICK-H::Ranbp2flox/flox (−/−) mice. Scale bar: 100 µm. (B) There is no difference in the number of YFP+ motoneurons between +/+ and −/− mice. Data are expressed as mean±s.d.; n=4 mice/genotype; Student's t-tests. (C) Dot and box-plot analyses of perikarya areas of YFP+ motoneurons in the anterior horns showing a significant increase of perikarya area (hypertrophy) in −/− mice at d10. Box-plot edges mark the 25th and 75th percentiles of the data, and the centerline shows the median value. ***P<0.001, *P<0.05, Mann–Whitney test, n=4 mice/genotype. (D) Transmission electron micrographs of representative ultra-thin cross-sections of sciatic nerves. Scale bar: 5 µm. (E) Quantitative analyses of g-ratios [ratio between the inner (axon) and outer diameter (axon plus myelin sheath) of the myelin sheath] and axonal diameters of sciatic nerves between genotypes. Data are expressed as mean±s.d. #P=0.058, *P<0.05, t-tests with GEE, n=4 mice/genotype. (F) Quantitative analyses of g-ratios and axonal diameters of phrenic nerves between genotypes. Data are expressed as mean±s.d. ***P<0.001, t-tests with GEE, n=4 mice/genotype. (G) Scatter plots between g-ratio and axonal diameter of fibers of sciatic nerves. Slopes of +/+ and −/− mice are 0.013±0.0017 and 0.038±0.003, respectively; ***P<0.001 (interaction term), t-tests with GEE, n=4 mice/genotype. Slope values are expressed as mean±s.e.m. (H,I) The sciatic nerve, but not the spinal cord, of −/− mice has decreased levels of free fatty acids (<70%; **P<0.01, Student's t-test, n=3 or 4 mice/genotype) (H) and phosphatidylcholine (∼50%; *P<0.05, Student's t-test, n=3 or 4 mice/genotype) (I) compared with +/+ mice at d9. (J,K) The acetylcholinesterase activity in the diaphragm (D) and gastrocnemius muscle (GM) (J), and the structures of neuromuscular junctions (K) appear normal in +/+ and −/− mice. Scale bars: 25 µm. Data are expressed as mean±s.d. in H-J. −/−, SLICK-H::Ranbp2flox/flox; +/+, SLICK-H::Ranbp2+/+; d0, d9 and d10 are days 0, 9 and 10 post-tamoxifen administration, respectively.

