Fig. 9.
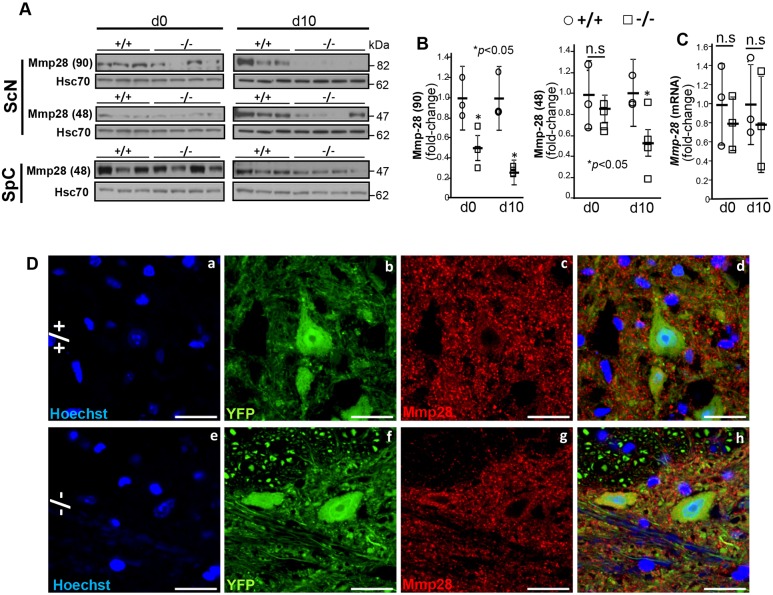
Post-transcriptional dysregulation of Mmp28 in the sciatic nerve. (A) Mmp28 resolves in SDS-PAGE as two distinct electrophoretic isoforms with apparent masses of 48 [Mmp28 (48)] and 90 kDa [Mmp28 (90)]. Immunoblots of equal amounts of homogenates of sciatic nerve (ScN) and spinal cord (SpC) show that Mmp28 (90) and Mmp28 (48) levels are reduced only in −/− sciatic nerve. Hsc70 is a loading control. For ScN d0, the same blots were used for P-Stat3, Stat3, Mmp28 and hsc70 in Figs 7 and 9. For SpC d0, the same blots were used for P-Stat3, Stat3, hnRNPH3, Mmp28 and hsc70 in Figs 7-9. For SpCd10, the same blots were used for P-Stat3, Stat3, Mmp28 and hsc70 in Figs 7 and 9. Lanes shown are experimental replicates. (B) Quantification analyses of immunoblots of Mmp28 in ScN showing a significant decrease in the levels of Mmp28 (90) at d0 and d10, and of Mmp28 (48) at d10 in −/− mice. *P<0.05, Student's t-test, n=4 mice/genotype. Data are expressed as mean±s.d. (C) RT-qPCR showing that the temporal and transcriptional profile of Mmp28 mRNA in the sciatic nerve is not changed between +/+ and −/− mice. Student's t-test, n=4 mice/genotype. Data are expressed as mean±s.d. (D) Representative confocal images of motoneurons in the anterior horn immunostained for Mmp28 show that YFP+ motoneurons do not show changes in the Mmp28 subcellular localization between genotypes. −/−, SLICK-H::Ranbp2flox/flox; +/+, SLICK-H::Ranbp2+/++/+; hsc70, heat shock protein 70; d0 and d10 are days 0 and 10 post-tamoxifen administration, respectively. Scale bars: 25 µm; n.s., non-significant.

