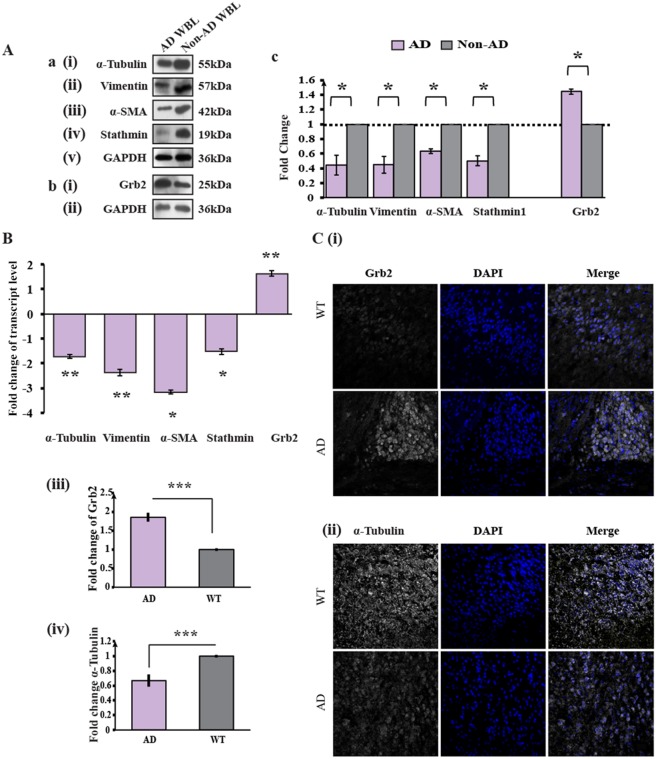
Fig. 1.
Expression levels of cytoskeletal proteins decrease and those of Grb2 increase in AD whole brain lysates and the APP/PS1 mouse model. (Aa) Representative western blots (n=2) of four cytoskeletal proteins – (i) α-tubulin, (ii) vimentin, (iii) α-SMA and (iv) stathmin 1 with (v) GAPDH used as an internal control in human AD whole brain lysates, compared to non-AD whole brain lysate. (Ab) Western blots (n=2) showing the (i) Grb2 and (ii) GAPDH levels in AD whole brain lysate. (Ac) Histogram representing the mean values of the optical density of the bands normalized against GAPDH, presented as the fold change relative to values in non-AD samples. (B) Transcript level changes in AD mouse brain tissue of genes encoding α-tubulin, vimentin, stathmin 1 and Grb2 by qRT-PCR, presented as the fold change relative to wild-type mouse brain tissue where it was normalized with internal control Gapdh gene. (C) Results of immunohistochemistry analysis for the expression of Grb2 and α-tubulin from paraffin-embedded sections of brain of AD mouse model and WT, where both Grb2 and α-tubulin staining was converted to greyscale, and the nucleus was stained with DAPI. Magnification, 60×. To gain a semi-quantitative analysis of the changes, pixel densities of the images were calculated using ImageJ software.

