
Fig. 2. YAP/β-catenin signaling as a function of substrate stiffness along mesoderm induction.
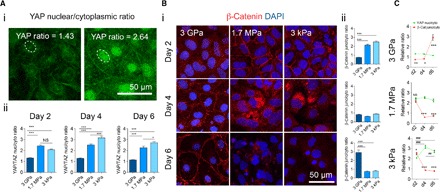
(A) (i) Sample of image quantification of the ratio between nuclear and cytoplasmic YAP intensity. (ii) YAP nuclear-to-cytoplasmic (nuc/cyto) ratios on days 2, 4, and 6 of differentiation on the various substrates. NS, not significant. (B) (i) Representative immunofluorescence images (red, β-catenin; blue, nuclei) and (ii) quantification of the junctional-to-cytosolic (junc/cyto) ratio of β-catenin expression on days 2, 4, and 6 of differentiation on the various substrates. DAPI, 4′,6-diamidino-2-phenylindole. (C) Comparison between YAP (green) and β-catenin (red) localization as a function of time on the various substrates (comparison between relative YAP and β-catenin localization reported as *; changes in the relative YAP nuclear-to-cytoplasmic ratio across days of differentiation reported as #). Data are represented as means ± SEM. */#P < 0.05, **/##P < 0.01, ***/###P < 0.001, two-way analysis of variance (ANOVA). At least three biological replicates were performed.