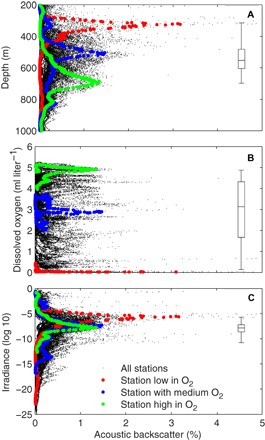
Fig. 2. Daytime distribution of acoustic backscatter in the mesopelagic (200 to 1000 m).

Percentage acoustic backscatter as a function of depth (A), ambient dissolved oxygen concentration (B), and ambient irradiance (C) of the backscatter. Black dots are data from all stations, and each dot represents the acoustic backscatter of a 2-m depth interval at a particular station as a percentage of total backscatter between 200 and 1000 m at that station. The acoustic backscatter marked in colors are from three stations with different oxygen regimes: low oxygen (Pacific Ocean, 15.9°N, 124.5°W), medium oxygen (Atlantic Ocean, 11.7°S, 31.4°W), and high oxygen (Indian Ocean, 29.6°S, 89.4°E). The boxplots show median, quartiles, and the range of the DSL WMDs for all stations.
