
Fig. 5. Measurement of dielectric response.
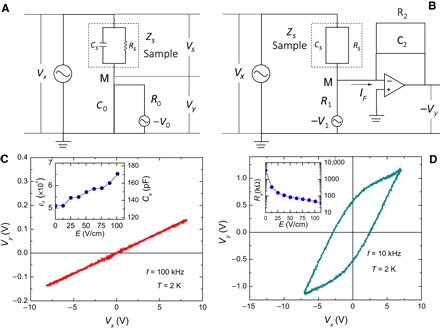
(A) Electrical circuit for measuring the relative dielectric constant ε1 of the sample. The voltage Vy ~ VxCs/C0 < Vx is proportional to the dielectric displacement D. By contrast, the applied voltage Vx is proportional to the electrical field E in the sample. Therefore, the curve of Vx versus Vy gives the relation between E and D, yielding the relative dielectric constant ε1 as a function of applied electric field E. (B) Modified electrical circuit of (A). The op-amp forces the point M to act as a virtual ground. The integration circuit yields Vy = VxCs/C2 when the relation V1/R1 = Vx/Rs is satisfied. Because C2 does not have to satisfy C2 ≫ Cs in (B), a large value for Vy can be realized. (C) Curve relating E and D (Vx versus Vy), which yields a relative dielectric constant ε1 as large as 5 × 10⁴ even in the limit E→0 (inset). This implies that the system is in the FE state. (D) Apparent nonlinear relation between Vx and Vy caused by nonlinearity in the resistive component Rs of the sample. The inset shows how Rs varies with increasing E.