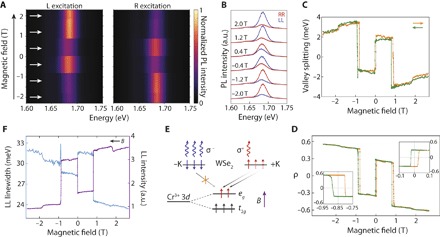
Fig. 2. Ferromagnetic substrate control of spin and valley pseudospin dynamics.

(A) Maps of the total PL intensity as a function of emission energy and applied magnetic field for left circular (L) and right circular (R) excitation. The black arrow indicates the applied magnetic field sweeping direction. (B) RR and LL spectra at selected magnetic fields [indicated by the white arrows in (A)]. See text for definition of RR and LL. a.u., arbitrary units. (C) Valley splitting and (D) normalized PL intensity difference between RR and LL (ρ) as a function of applied magnetic field sweeping up (orange) and down (green). Insets in (D) are zoomed-in plots of hysteresis curves. (E) Schematic depicting the spin orientation–dependent charge hopping between WSe2 and CrI3, which leads to the excitation helicity-dependent PL intensity in (A). See text for detailed description. (F) PL spectral linewidth (blue) and intensity (purple) versus applied magnetic field (sweeping from positive to negative) for the LL condition. Broad width is always associated with weak PL intensity.
