. 2017 May 6;6:e26120. doi: 10.7554/eLife.26120

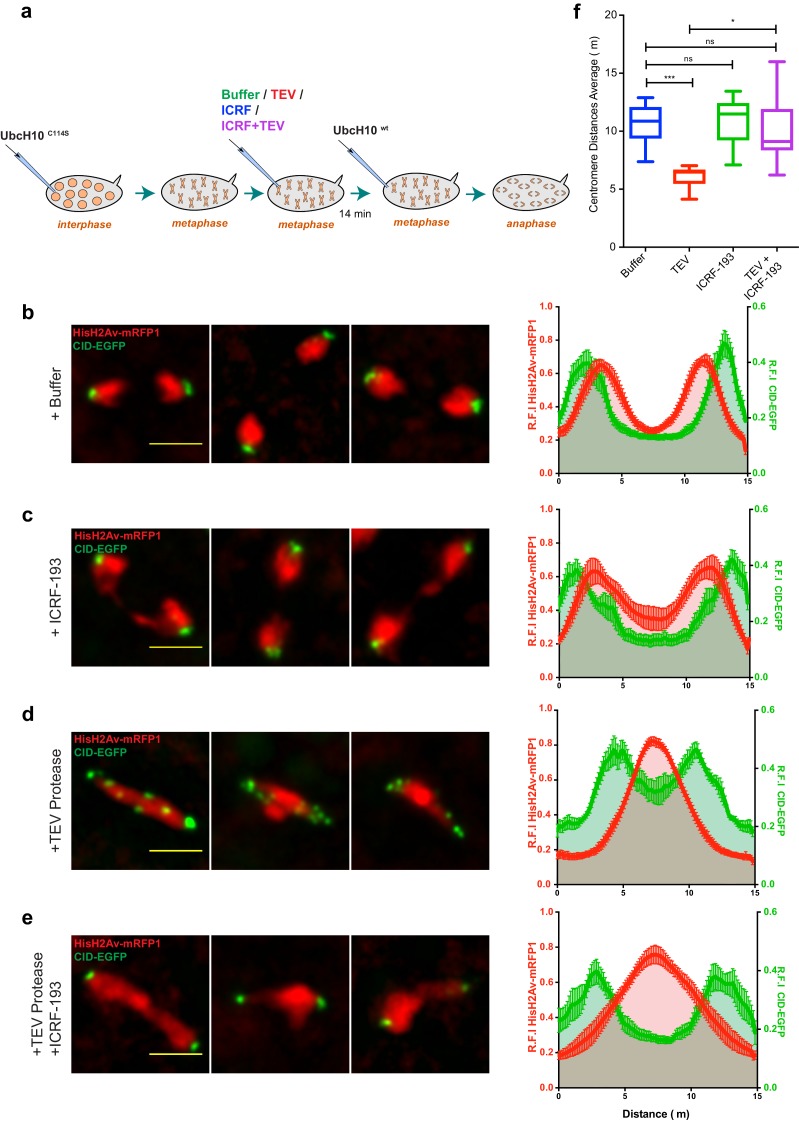
Figure 6. Condensin I inactivation results in TopoII-dependent sister chromatids intertwines and segregation failure.

(a) Schematic representation of the experimental set-up. Embryos were arrested with 12 mg/ml UbcH10C114S and injected with buffer (b), 280 μM ICRF-193 (c), 13 mg/ml TEV protease (d) or TEV+ICRF-193, while in metaphase; Embryos were subsequently injected with 14 mg/ml of a wild-type version of UbcH10 to release them from the arrest. Images depict representative images of the anaphase; Graphs plot the relative distribution of HisH2Av-mRFP1 and Cid-EGFP across the 15 μm segregation plane, measured 4–6 min after anaphase onset. Graphs plot the average +_SEM of individual embryos (n ≥ 10 embryos for each experimental condition). For each embryo, at least eight anaphases were analysed. (f) Quantification of centromere distances during UbcH10wt-induced anaphase as in (b–e). Graphs plot the distances between segregating centromeres measured 6 min after anaphase onset (n ≥ 10 embryos for each experimental condition; for each embryo, at least eight anaphases were analysed). Statistical analysis was performed using the non-parametric Kruskal-Wallis test; ns p>0.05, *p<0.05; ***p<0.001.

DOI: http://dx.doi.org/10.7554/eLife.26120.021

Figure 6—source data 1. Measurements of segregation efficiency after metaphase-specific inactivation of condensin and/or Topoisomerase II.
Anaphase profiles for HisH2Av-mRFP1 and Cid-EGFP measured 4–6 min after anaphase onset (Figure 6b-2). Each measurement represents the average for independent embryos (resulting from at least eight anaphases measured). Individual sheets include either the same measurement for the four experimental conditions or both Cid-EGFP and HisH2Av-mRFP1 for the same experiment, as indicated. Centromere separation measurements (Figure 6f) also include descriptive statistics.
elife-26120-fig6-data1.xlsx (277.6KB, xlsx)
DOI: 10.7554/eLife.26120.022

Figure 6.

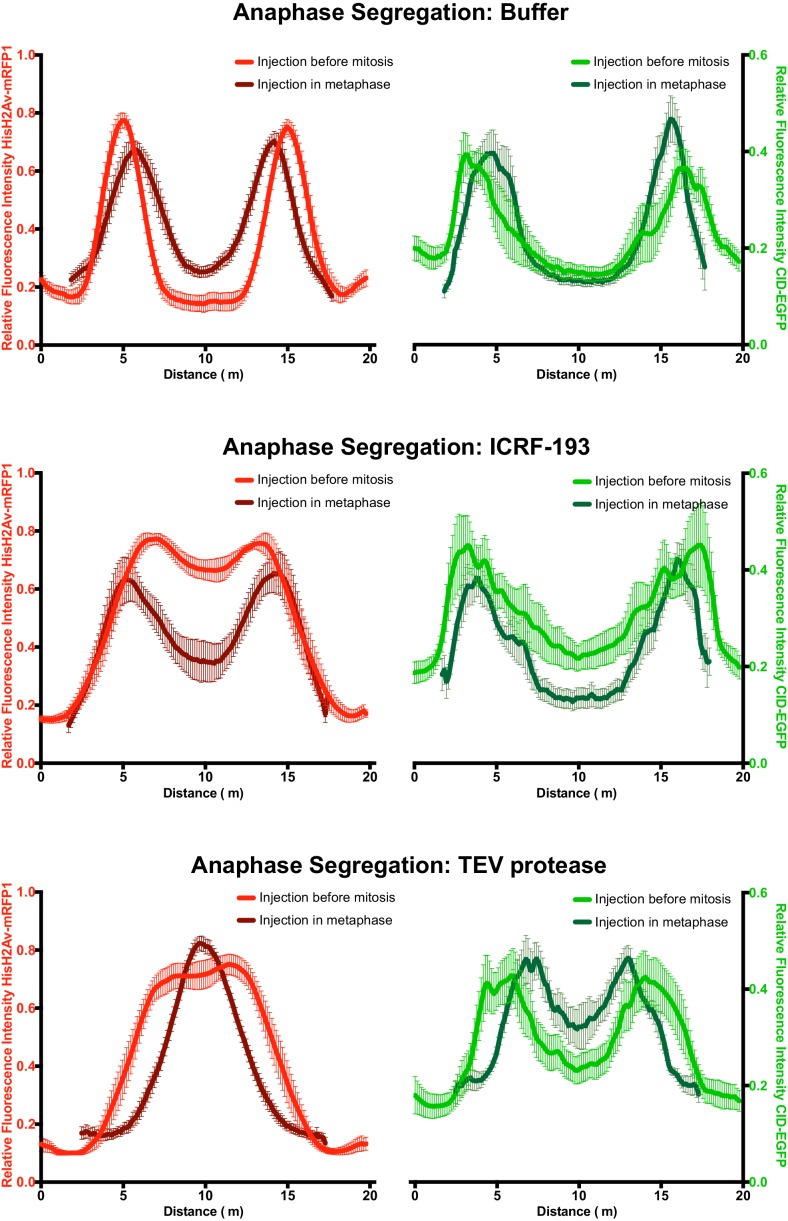
Figure 6—figure supplement 1. – Comparative analysis of segregation efficiency for condensin and/TopoII inhibition before mitosis (light colour) and during metaphase arrest/release (dark colour); Graphs plot the relative distribution of HisH2Av-mRFP1 (red) and Cid-EGFP (green) across a 20 μm segregation plane, measured 4–6 min after anaphase onset.

Figure 6—figure supplement 1.

Graphs plot the average +_SEM of individual embryos (n ≥ 8 embryos for each experimental condition). For each embryo, at least eight anaphases were analysed.