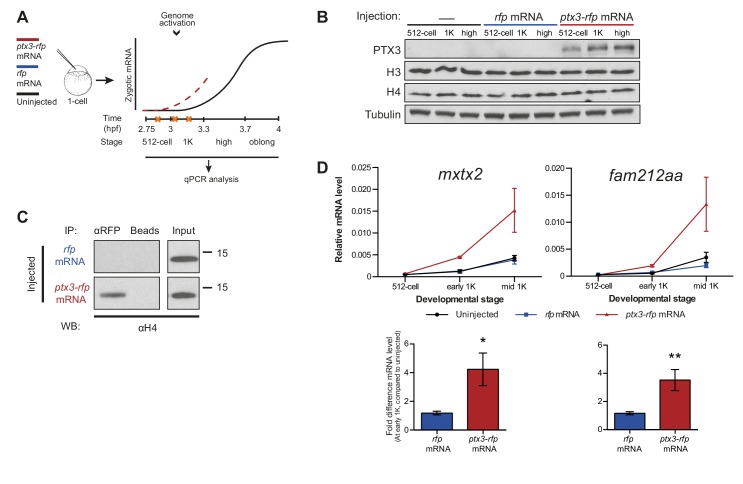
Figure 3. Decreasing the level of histones causes premature transcription.
(A) Schematic representation of experimental procedure. ptx3-rfp or rfp (control) mRNA was injected into the cell of 1-cell embryos and qPCR analysis was carried out at stages around genome activation. Orange crosses represent the timing of stages used for the analysis. (B) Western blot analysis of PTX3, histone H3 and H4 levels at 512-cell, 1K and high stage in uninjected embryos, rfp and ptx3-rfp mRNA-injected embryos. Tubulin was used to control for equal loading. Blots shown are representative examples (n = 3). (C) Western blot analysis for histone H4 after a pull-down using an RFP antibody at 1K stage. Uncoupled beads were used as a negative control. Blot shown is a representative example (n = 3). (D) Expression of mxtx2 and fam212aa was analyzed by qPCR at 512-cell, early 1K, and mid 1K stage in uninjected, rfp mRNA-injected and ptx3-rfp mRNA-injected embryos. Bar graphs focus on early 1K stage. Error bars represent SEM (n ≥ 4). *p<0.05; **p<0.01 (two-tailed Student’s t-test, compared to rfp mRNA control). mRNA levels are normalized to the expression of eif4g2α.


