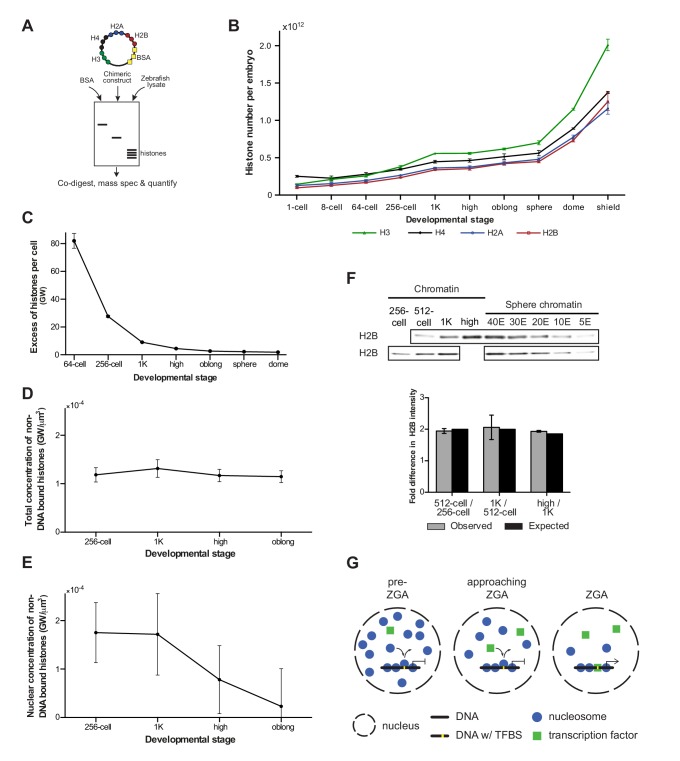
Figure 4. Onset of transcription coincides with a reduction in nuclear histone concentration.
(A) Our quantitative mass spectrometry approach. Zebrafish histones were quantified by comparing the abundances of native histone peptides with corresponding isotopically labeled peptides from the chimeric protein; chimeric protein was quantified by comparing the abundance of labeled (from chimera) and native (from standard) BSA peptides (see Materials and methods for more details). (B) Quantification of the number of histone H3, H4, H2A, and H2B per embryo at indicated stages by quantitative mass spectrometry. Error bars represent SEM (n = 3). (C) The excess number of histones per cell (in genomes worth) was calculated using H2B levels (Figure 4—source data 1) and cell numbers (Figure 1—source data 1), and by assuming an average of 1.5 genomes per cell (see Materials and methods for more details). For better visualization of the data at later developmental stages the values for 1-cell and 8-cell are not shown in the graph but are 3098 and 518, respectively. Error bars represent SEM (n = 3). GW, genomes worth of histones. (D) The total concentration of non-DNA-bound histones was calculated by dividing the excess genomes worth of histone H2B per embryo by the volume of the animal cap at the respective stages (Figure 4—figure supplement 1A). Error bars represent SEM of animal cap volumes (n = 3). GW, genomes worth of histones. (E) The nuclear concentration of non-DNA-bound histones was calculated from immunofluorescence (from left to right n = 12, 12, 14, 15) combined with live imaging and mass spectrometry data (see Materials and methods for more details). Error bars represent SEM of animal cap volumes (n = 3). (F) Relative differences in H2B intensity between chromatin fractions of 256-cell, 512-cell, 1K, and high stage embryos. Sphere stage embryos were used to determine the linear range of H2B detection (see also Figure 4—figure supplement 1C). Blots shown are representative examples (n ≥ 3). Plots show observed fold differences in H2B intensity in chromatin fractions comparing indicated stages compared to the differences that would be expected if the intensity were to scale with the amount of DNA (E, embryo). (G) Competition model. See text for more details (TFBS, transcription-factor-binding site).
DOI: http://dx.doi.org/10.7554/eLife.23326.012


